Content
Published:
This is an archived release.
Non-profit institutions’ value added almost NOK 100 billion
Non-profit institutions’ gross value added, including the value of volunteer work, is estimated at NOK 98 billion in 2009. This was NOK 4.6 billion, or 5 per cent more than the year before. Compared to 2006, the value added in 2009 has increased by NOK 16 billion.
Excluding the value of volunteer labour, in line with the recommendations for the national accounts, the total value added amounts to NOK 41 billion. This is an increase of NOK 2.7 billion from 2008, and nearly NOK 9 billion from 2006.
As share of gross domestic product (GDP), non-profit institutions’ value added, excluding voluntary work, totalled 1.7 per cent in 2009. This share is higher in 2009 than in the two previous years, but must be viewed in light of the considerable price fall for crude oil and natural gas, which reduced the value of GDP.
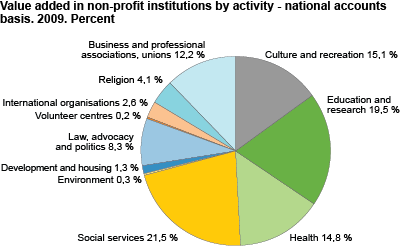
Activities as shares of gross value added stable
Health and social services still account for almost a third of all paid activity by non-profit institutions, with a value added of NOK 15 billion in 2009. The growth rate is however declining and this is partly due to commercial firms’ growing tendency to cooperate with the local authorities in providing services at the expense of non-profit institutions.
The smaller categories, such as environment and animal protection and volunteer centres, indicate the highest growth rates. The latter category’s share of non-profit institutions’ value added is however unaltered, at 2 per cent, despite several new establishments in recent years.
Also within the activity categories there are few changes. Business and professional associations and unions are still dominated by the labour unions, which accounted for just over NOK 2.6 billion in value added in 2009.
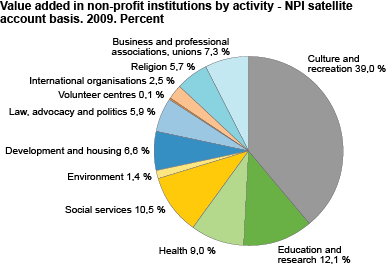
Including volunteer work alters the share of total value added
Volunteer work is valued at NOK 57 billion in 2009. When taking this into account, the individual categories’ shares of value added are altered. Culture and recreation takes on the largest portion, as opposed to social services. The latter category as a share of non-profit institutions’ total value added, including the value of volunteer work, is reduced from 22 per cent to slightly more than 10 per cent in 2009; whereas the share of culture and recreation increases from 15 to nearly 40 per cent.
Gradual move from unpaid to paid work
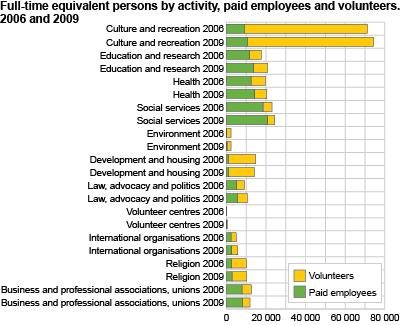
Volunteer work contributes with around 58 per cent of total value added in 2009, indicating a considerable scope of volunteer work within Norway. However, when compared to previous years in the period 2006-2009, this share has decreased, from 61 per cent in 2006.
The figures also indicate that the number of full-time equivalent paid employees rose more than the number of full-time equivalent volunteers. This increase amounted to more than 3 000 employees, whereas the number of volunteers only increased by just under 300 full-time equivalents. Different growth rates affect the ratio of volunteers per paid worker. In 2009, around one and a half volunteers contributed per paid full-time equivalent employee. Within the housing category, including among other housing cooperatives and neighbourhood organisations, we find the highest number of volunteers per paid worker, at 11 man-years of voluntary labour. However, the housing category is relatively small in scope. In terms of number of volunteers, culture and recreation engages the most, with almost 64 000 unpaid full-time equivalent volunteers in 2009. This is nearly 1 800 full-time equivalents more than in 2006.
For certain categories the degree of voluntary participation has declined in the period 2006-2009. The strongest decline is found within the category business and professional associations and unions, but also health and social services show the same decline, as opposed to the growth in the number of full-time equivalent employees.
| 2006 | 2007 | 2008 | 2009 | ||||||||||||||||||||||||||||||||||||||||||||||||||||||||||||||||||||||||||||
|---|---|---|---|---|---|---|---|---|---|---|---|---|---|---|---|---|---|---|---|---|---|---|---|---|---|---|---|---|---|---|---|---|---|---|---|---|---|---|---|---|---|---|---|---|---|---|---|---|---|---|---|---|---|---|---|---|---|---|---|---|---|---|---|---|---|---|---|---|---|---|---|---|---|---|---|---|---|---|---|
| Non-profit institutions - national account basis | |||||||||||||||||||||||||||||||||||||||||||||||||||||||||||||||||||||||||||||||
| Output. NOK million | 62 812 | 67 774 | 73 674 | 78 814 | |||||||||||||||||||||||||||||||||||||||||||||||||||||||||||||||||||||||||||
| Value added. NOK million | 31 934 | 34 992 | 37 952 | 40 642 | |||||||||||||||||||||||||||||||||||||||||||||||||||||||||||||||||||||||||||
| Full-time equivalent persons (paid employees). Level | 70 864 | 73 893 | 76 724 | 79 777 | |||||||||||||||||||||||||||||||||||||||||||||||||||||||||||||||||||||||||||
| Value added as share of GDP. Per cent | 1.5 | 1.5 | 1.5 | 1.7 | |||||||||||||||||||||||||||||||||||||||||||||||||||||||||||||||||||||||||||
| Value added as share of GDP Mainland Norway. Per cent | 2.0 | 2.0 | 2.0 | 2.2 | |||||||||||||||||||||||||||||||||||||||||||||||||||||||||||||||||||||||||||
| Full-time equivalent persons (paid employees) as share of total full-time equivalent persons in Norway. Per cent | 3.3 | 3.3 | 3.3 | 3.5 | |||||||||||||||||||||||||||||||||||||||||||||||||||||||||||||||||||||||||||
| Non-profit institutions - NPI satellite account basis | |||||||||||||||||||||||||||||||||||||||||||||||||||||||||||||||||||||||||||||||
| Output included replacement cost value of volunteer work. NOK million | 112 744 | 120 147 | 128 875 | 135 946 | |||||||||||||||||||||||||||||||||||||||||||||||||||||||||||||||||||||||||||
| Value added included replacement cost value of volunteer work. NOK million | 81 866 | 87 365 | 93 152 | 97 774 | |||||||||||||||||||||||||||||||||||||||||||||||||||||||||||||||||||||||||||
| Full-time equivalent volunteers. Level | 114 043 | 114 329 | 114 616 | 114 903 | |||||||||||||||||||||||||||||||||||||||||||||||||||||||||||||||||||||||||||
| Total full-time equivalent persons (paid employees and volunteers). Level | 184 907 | 188 222 | 191 340 | 194 680 | |||||||||||||||||||||||||||||||||||||||||||||||||||||||||||||||||||||||||||
| Value added included replacement cost value of volunteer work as share of GDP1. Per cent | 3.7 | 3.7 | 3.6 | 4.1 | |||||||||||||||||||||||||||||||||||||||||||||||||||||||||||||||||||||||||||
| Value added included replacement cost value of volunteer work as share of GDP Mainland Norway2. Per cent | 5.0 | 4.8 | 4.9 | 5.1 | |||||||||||||||||||||||||||||||||||||||||||||||||||||||||||||||||||||||||||
| Full-time equivalent volunteers as share of total full-time equivalent persons in Norway3. Per cent | 5.1 | 4.9 | 4.7 | 4.8 | |||||||||||||||||||||||||||||||||||||||||||||||||||||||||||||||||||||||||||
| Total full-time equivalent persons (paid employees and volunteers) in non-profit institutions as share of total full-time equivalent persons in Norway3. Per cent | 8.3 | 8.0 | 7.9 | 8.1 | |||||||||||||||||||||||||||||||||||||||||||||||||||||||||||||||||||||||||||
| 1 | GDP including replacement cost value of volunteer work. |
| 2 | GDP Mainland Norway including replacement cost value of volunteer work. |
| 3 | Total full-time equivalent persons in Norway including full-time equivalent volunteers. |
A satellite account for non-profit institutionsThe Norwegian satellite account for non-profit institutions is based on the UN handbook (Handbook on Non-Profit Institutions in the System of National Accounts) , thus ensuring the best possible comparison across time and between countries. A satellite account offers the possibility of focusing on non-profit institutions in a more thorough and detailed manner than that possible within the standardised framework of the national accounts. According to the handbook, a significant element in the satellite account is to include the effort of both paid employees and volunteers. By including voluntary, unpaid labour, the satellite account exceeds the boundary of the ordinary national accounts, where voluntary labour is not valued. This means that in the NPI satellite account only the figures compiled on a national accounts basis are directly comparable to the figures in the ordinary national accounts.
The non-profit institutions in the satellite account are grouped according to activity by the UN’s standard classifications system ICNPO (International Classification of Non-Profit Organizations).
The satellite account for non-profit institutions initially only reflects the organisations’ costs and labour input. As new statistics become available, the satellite account will be further developed by also including income, and thus become a complete accounting system for the non-profit institutions. |
Tables:
Contact
-
Sindre Midttun
E-mail: sindre.midttun@ssb.no
tel.: (+47) 41 62 78 05
-
Nils Amdal
E-mail: nils.amdal@ssb.no
tel.: (+47) 91 14 91 46