Content
Published:
This is an archived release.
NI contributions within private sector increase 4.01 per cent
The basis for employers’ National Insurance (NI) contributions amounted to NOK 1.194 billion in 2014; an increase of 4.7 per cent from 2013. By comparison, the growth from 2012 to 2013 was 5.1 per cent.
| 2013 | 2014 | |||
|---|---|---|---|---|
| Total basis for employer's National insurance contributions | Calculated employer's National insurance contributions | Total basis for employer's National insurance contributions | Calculated employer's National insurance contributions | |
| Both private and public sector | 1 140 209 | 148 854 | 1 194 103 | 155 455 |
| Public sector | 298 470 | 37 551 | 318 308 | 39 975 |
| Private sector | 841 739 | 111 304 | 875 795 | 115 480 |
| Zone 1 | 727 018 | 102 510 | 754 257 | 0 |
| Zone 1a | 26 151 | 3 037 | 20 886 | 0 |
| Zone 2 | 21 259 | 2 257 | 29 780 | 0 |
| Zone 3 | 8 399 | 538 | 9 116 | 0 |
| Zone 4 | 31 990 | 1 651 | 33 214 | 0 |
| Zone 4a | 16 034 | 1 258 | 16 641 | 0 |
| Zone 5 | 10 107 | 0 | 10 992 | 0 |


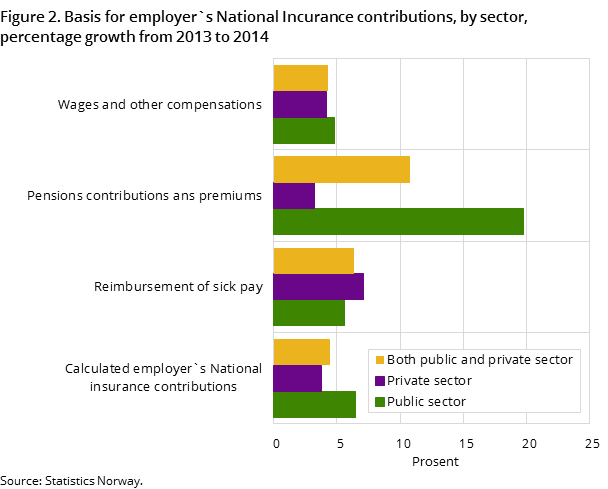
Within the public sector, the basis for employers’ National Insurance contributions increased by 6.6 per cent between 2013 and 2014. Correspondingly, the private sector experienced a growth of 4.01 per cent.
Municipalities relocated to new zones
Within the private sector, the basis for employers’ National insurance contributions constituted NOK 8761 billion in 2014. Employers’ contributions to National insurance are divided into different rates by region; each municipality is assigned to a zone. From 1 July 2014, 31 municipalities were relocated to zones with lower contribution rates, from zone 1a to zones 2 and 3 respectively. This caused a decrease of 19.9 per cent in wages and other compensations in zone 1a from 2013 to 2014. Correspondingly, zones 2 and 3 experienced a growth of 40.3 per cent and 8.4 per cent respectively in wages and other compensations.
Increase in pension contributions and premiums within the public sector
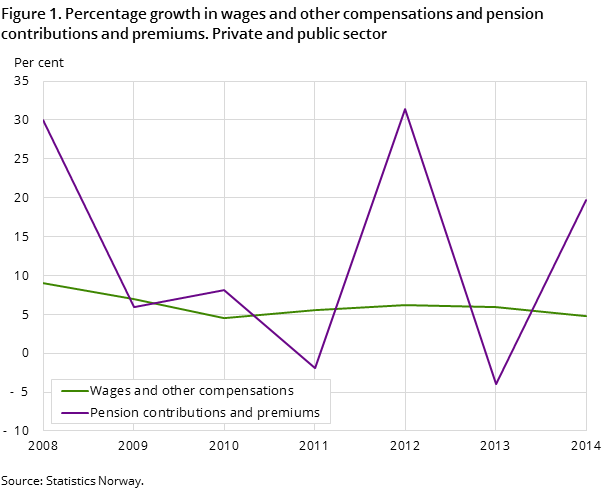
Within the public sector, the basis for employer’s National insurance contributions constituted NOK 318 billion in 2014. Pension contributions and premiums subject to National Insurance contributions increased by 19.7 per cent between 2013 and 2014. For the corresponding period last year, pension contributions and premiums decreased by 4.0 per cent. The variation of pension contributions and premiums is related to the nature of the liability to pay duty.
Urban municipalities provide the highest contribution to wage totals within the private sector
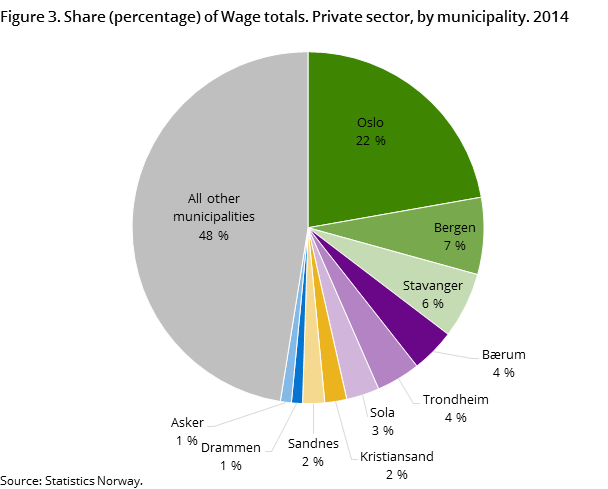
Three of the largest cities account for 35 per cent of wage totals; Oslo, Bergen and Stavanger. A total of 21.9 per cent of reported wage totals are reported on enterprises in Oslo. Figure 3 shows the ten municipalities with the highest wage totals. These municipalities make up 53 per cent of the combined wage totals of all municipalities in Norway.
1 Figures were corrected 17 July 2015.
Additional information
Employers’ contributions to National Insurance are divided into different rates by region.
Contact
-
Thomas Hagen
E-mail: thomas.hagen@ssb.no
tel.: (+47) 40 81 13 20
-
Heidi Bekkevold Backe
E-mail: heidi.backe@ssb.no
tel.: (+47) 40 81 13 22
-
Marianne Mellem
E-mail: mnm@ssb.no
tel.: (+47) 40 81 14 42
