Content
Published:
This is an archived release.
Employment in Oslo decreased
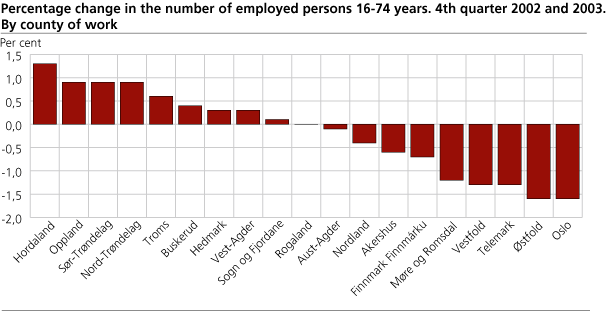
The number of employed persons working in Østfold and Oslo decreased by 1.6 per cent, or 1 700 and 6 300 employed persons respectively, from the 4t h quarter of 2002 to the 4t h quarter of 2003. Hordaland had the largest increase by 1.3 per cent, or 2 700 employed persons. For the country as a whole the decrease amounted to 0.3 per cent, or 7 000 employed persons.
Nearly half of the counties had a decrease in the number of employed persons, from the 4th quarter of 2002 to the 4th quarter of 2003. With the exception of Østfold, Oslo, Vestfold, Telemark and Møre og Romsdal, the changes were less than one per cent, according to new figures from the register-based employment statistic.
One out of three commutes
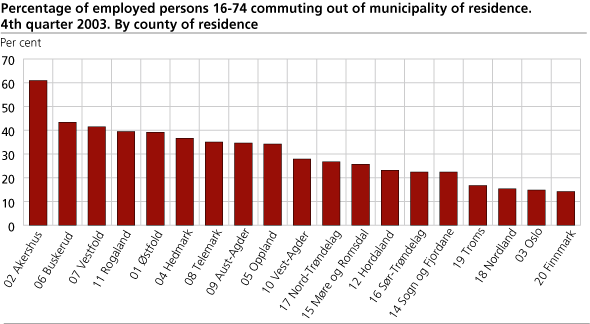
In the 4t h quarter 2003 31.8 per cent of the employed persons worked in a different municipality from the one the resided in, compared with 32.0 per cent the previous year. Akershus had the largest percentage of out-commuters, which means that an employed person is working in another municipality. The municipalities with lowest out-commuting were found in Finnmark, Oslo, Nordland and Troms, where less than 20 per cent commuted out of their municipality of residence.
New: Detailed figures for occupation
Beginning with 2003, the register-based employment statistics will also include distribution by occupation. However, employed persons within the health enterprises and municipal and county administration are for the time being not included in the tables with distribution by occupation.
The register-based employment statistics is published once a year. More detailed figures for health care personnel are released on 18 June and for immigrants on 24 June. More tabels are available in the StatBank.
Tables:
- Table 1 Population and employed persons 16-74 years, by sex and county of residence. 4th quarter 2002 and 2003
- Table 2 Employed persons 16-74 years, by age and county of residence. 4th quarter 2002 and 2003
- Table 3 Employed persons 16-74 years, by age and County of Residence. 4th quarter 2002 and 2003. Per cent of population
- Table 4 Employed persons 16-74 years, by age and county of residence. 4th quarter 2002 and 2003. Per cent
- Table 5 Employed persons 16-74 years, by age and County of Residence. Male. 4th quarter 2002 and 2003. Per cent
- Table 6 Employed persons 16-74 years, by age and County of Residence. Female. 4th quarter 2002 and 2003. Per cent
- Table 7 Employed persons 16-74 years, by sex, settled/usual working hours per week. 4th quarter 2002 og 2003. Per cent
- Table 8 Employed persons 16-74 years, by age, settled/usual working hours per week. 4th quarter 2003. Per cent
- Table 9 Employed persons 16-74 years, by sex, county of work and industry division. 4th quarter 2002 and 2003.
- Table 10 Employed persons 16-74 years, by sex, county of work and industry division. 4th quarter 2003. Per cent
- Table 11 Employed persons 16-74 years, by sex, settled/usual working hours per week and industri division. 4th quarter 2003. Per cent
- Table 12 Employed persons 16-74 years, by age and industri division. 4th quarter 2003. Per cent.
- Table 13 Employed persons 16-74 years, by sector and industrial division. 4th quarter 2003
- Table 14 Employed persons 16-74 years by sex, field of study and level of education. 4th quarter 2002 and 2003
- Table 15 Employed persons 16-74 years, by level and education, sex and county of residence. 4th quarter 2002 and 2003. Per cent
- Table 16 Employed persons 16-74 years, by occupation and municipality of work. 4th quarter 2003
- Table 17 Employed persons 16-74 years, by occupation and sex. 4th quarter 2003
- Table 18 Employed persons 16-74 years, by occupation and age. 4th quarter 2003
Contact
-
Pål Nordby
E-mail: pal.nordby@ssb.no
tel.: (+47) 40 90 23 78
-
Stine Bakke
E-mail: stine.bakke@ssb.no
tel.: (+47) 91 52 62 51
-
Arbeidsmarked og lønn
E-mail: arbeidsmarked@ssb.no


