Content
Published:
This is an archived release.
Stock investments improved profit in insurance
The insurance companies' profit fluctuates with the development in the security market. A 40 per cent growth at Oslo Stock Exchange and substantial growth in the global security markets from 2002 to 2003, were the main reason for the change in profitability for in the insurance business.
Life insurance
The Life insurance companies had a profit of NOK 7.3 billion before tax and allocation to customers. In comparison the loss came to NOK 2 billion in 2002. Net income from financial assets contributed with NOK 3.6 billion and grew from 661 million in 2002.
If we add the revaluation reserve and additional transfers to the profit before tax and allocation to customers we get a value-adjusted result of NOK 17.8 billion.
Earned premiums exclusive transfers to other companies increased by 8.5 per cent to NOK 43 billion 1 in 2003, while claims incurred increased by 1.5 per cent and were about at the same level as in previous years.
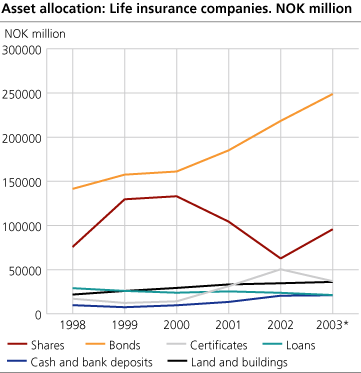
Total assets for life insurance companies increased by 11 per cent from 2002 to 2003 and ended at NOK 477 billion at the end of 2003. Shares and shares in securities fund were again increasing as a percentage of the total assets and count for NOK 95 billion or 20 per cent of the total assets at the end of 2003.
The allocation between different investment vehicles is shown in the graph. We can read from the figures how much that are invested in different assets, and how the life insurance companies changes investment profile with the development in the security markets.
Non-life insurance
The result of the technical account separates income and costs directly attached to insurance activities. In 2003 the profit of the technical account was NOK 1 billion and decreased by NOK 178 million from 2002. Earned premiums developed positively and rose more than the claims incurred. As a consequence of this development the decline of the technical account comes as a result of higher expenses in other insurance related activities.
Profit of ordinary activities was considerable improved due to the substantial rise in the income from net financial assets. Income from net financial assets was NOK 8.1 billion in 2003 compared with a loss of NOK 404 million in 2002. This gives a profit from ordinary activities of NOK 6.2 billion in 2003.
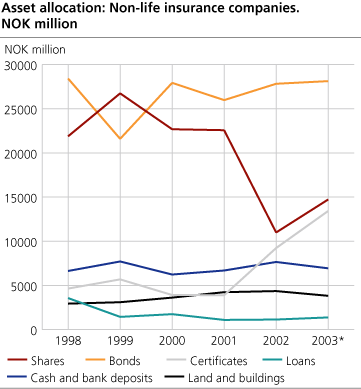
From 2002 to 2003 the total assets increased by 8.7 per cent to NOK 105 billion. The non-life insurance companies also increased their investments in shares and shares in securities fund. These investments roseby 14 per cent relative to total assets, and amounted to NOK 14.7 billion at the end of 2003. The investments in bonds declined somewhat relative to the total assets and came to NOK 28 billion at the end of 2003. The holdings of certificates increased from 9.2 to 13.4 billion and constituted 12 per cent of the total assets in 2003.
From the figure can we observe that also the non-life insurance companies changes their asset allocation according to the changes in the financial markets.
Tables
Contact
-
Kjell Hammer
E-mail: kjell.hammer@ssb.no
tel.: (+47) 40 90 26 76
-
Ola Tveita
E-mail: ola.tveita@ssb.no
tel.: (+47) 99 73 45 83


