Content
Published:
This is an archived release.
Decreasing gross domestic debt growth
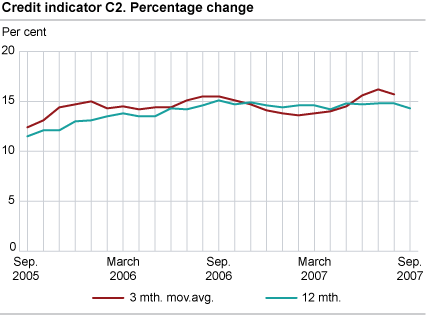
The twelve-month growth in the credit indicator C2 was 14.3 per cent to end-September, down from 14.8 per cent to end-August. Both non-financial enterprises and households contributed to the decrease in the C2 growth, but the growth is still at a high level.
Non-financial enterprise gross domestic debt was NOK 972 billion at end-September. The twelve-month growth was 20.1 per cent, down from 21.1 per cent to end-August. This means that the growth rate has then been higher than 20 per cent every month since August 2006. The growth in enterprise money supply was 23.3 per cent to end-September according to the M2 statistics ; i.e. it continues to be higher than the growth in enterprise debt. The strong growth in non-financial enterprise gross debt and money supply is related to the strong growth in the Norwegian economy.
Fall in household debt growth
Household gross domestic debt was NOK 1 693 billion at end-September. The twelve-month growth was 11.8 per cent to end-September, down from 12 per cent to end-August. The average twelve-month growth in household gross domestic debt in the first nine months of 2007 was 12.1 per cent, compared to an average growth of 13 per cent during 2006. However, the growth in household gross debt to end-September 2007 is still higher than the growth in household money supply (9.1 per cent).
Effects of portfolio shifts and IFRS
About 71 per cent of the general public gross domestic debt of NOK 2 861 billion at end-September consists of bank loans. The twelve-month growth in bank loans fell from 16.8 per cent to end-August to 16.7 per cent to end-September. The twelve-month growth in credit from mortgage companies fell from 15.2 to 13.3 per cent and the twelve-month growth in credit from finance companies fell from 10.1 per cent to 9 per cent in the same period. The growth rates of loans from banks, mortgage companies and finance companies are influenced by shifts in loan portfolios between these institutions. Since March 2007, the data have also been affected by the implementation of the international financial reporting standards, IFRS, which may lead to more fluctuations in the data than previously.
| July 2007 | August 2007 | September 2007 | |||||||||||||||||||||||||||||||||||||
|---|---|---|---|---|---|---|---|---|---|---|---|---|---|---|---|---|---|---|---|---|---|---|---|---|---|---|---|---|---|---|---|---|---|---|---|---|---|---|---|
| 12 mth total | 14.8 | 14.8 | 14.3 | ||||||||||||||||||||||||||||||||||||
| 3 mth mov.avg.tot | 16.2 | 15.7 | |||||||||||||||||||||||||||||||||||||
| 12 mth households | 12.3 | 12.0 | 11.8 | ||||||||||||||||||||||||||||||||||||
|
C2 is an approximate measure of the size of the gross domestic debt of the general public (households, non-financial enterprises and municipalities) in NOK and foreign currency. Statistics Norway also compiles the credit indicator C3, which in addition to C2 (the public’s domestic gross debt) also includes the public’s external loan debt. Most of the public’s external loan debt refers to non-financial enterprises. The C3 statistics are published approximately one month later than the C2. See http://www.ssb.no/english/subjects/11/01/k3_en/ |
The statistics is now published as Credit indicator.
Contact
-
Statistics Norway's Information Centre
E-mail: informasjon@ssb.no
tel.: (+47) 21 09 46 42