Content
Published:
This is an archived release.
Continued rise in enterprise debt growth
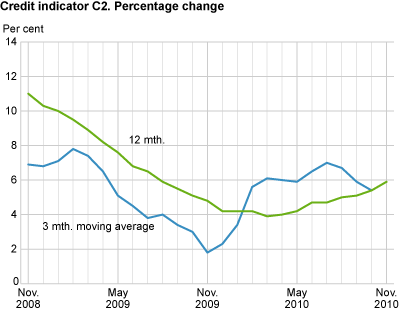
The twelve-month growth in the credit indicator C2 was 5.9 per cent to end-November, up from 5.4 per cent to end-October. Debt growth increased for municipalities, households and non-financial enterprises.
The general public’s gross domestic debt C2 amounted to NOK 3 618 billion at end-November, up from NOK 3 580 billon at end-October.
Non-financial enterprises pull up most of the debt growth
Non-financial enterprises’ gross domestic debt amounted to NOK 1 214 billion at end-November. The twelve-month growth was 3.0 per cent to end-November, up from 2.1 per cent to the previous month. The growth in enterprise debt has been increasing since end-March 2010.
The growth based on the three-month moving average of the non-financial gross debt was 1.1 per cent for the period September-November compared with the previous three months. The fact that the growth based on the three-month moving average is lower than the twelve-month growth could be an indication that the twelve-month growth will fall.
Rise in household debt growth
Household gross domestic debt totalled NOK 2 115 billion at end-November. The twelve-month growth was 6.4 per cent to end-November, up from 6.2 per cent to the previous month.
High debt growth for municipalities
Municipalities’ gross domestic debt totalled NOK 290 billion at end-November. The twelve-month growth was 15.1 per cent to end-November, up from 14.3 per cent to the previous month. In the last two years the debt growth for the municipalities has been high; from 2009 to 2010 so far the growth has been between 11.5 per cent and 16.0 per cent.
| June 2010 |
July 2010 |
Aug. 2010 |
Sep. 2010 |
Oct. 2010 |
Nov. 2010 |
||||||||||||||||||||||||||||||||||||||||||||||||||||||||||||||||||||||||||
|---|---|---|---|---|---|---|---|---|---|---|---|---|---|---|---|---|---|---|---|---|---|---|---|---|---|---|---|---|---|---|---|---|---|---|---|---|---|---|---|---|---|---|---|---|---|---|---|---|---|---|---|---|---|---|---|---|---|---|---|---|---|---|---|---|---|---|---|---|---|---|---|---|---|---|---|---|---|---|---|
| 12 mth. total | 4.7 | 4.7 | 5.0 | 5.1 | 5.4 | 5.9 | |||||||||||||||||||||||||||||||||||||||||||||||||||||||||||||||||||||||||
| 3 mth. moving average tot | 6.5 | 7.0 | 6.7 | 5.9 | 5.4 | ||||||||||||||||||||||||||||||||||||||||||||||||||||||||||||||||||||||||||
| 12 mth. households | 6.2 | 6.1 | 6.2 | 6.3 | 6.2 | 6.4 | |||||||||||||||||||||||||||||||||||||||||||||||||||||||||||||||||||||||||
| 12 mth. non-financial enterprises | 0.5 | 0.6 | 1.3 | 1.4 | 2.1 | 3.0 | |||||||||||||||||||||||||||||||||||||||||||||||||||||||||||||||||||||||||
Growth rates are affected by portfolio shifts
Of the general public’s gross domestic debt, 55 per cent consisted of bank loans. The twelve-month growth in bank loans increased from -4.1 per cent to end-October to -3.2 per cent to end-November. Mortgage companies’ loans amounted to NOK 1 013 billion and the twelve-month growth went down from 32.3 per cent to 30.4 per cent in the same period. The growth rates are affected by transfers of loans from banks to mortgage companies. The growth rate for banks and mortgage companies in total was 6.1 per cent to end-November, up from 5.8 per cent to end-October.
The twelve-month growth rate in bond debt was 3.0 per cent to end-November, unchanged from the previous month. The twelve-month growth rate in certificate debt was -4.3 per cent to end-November, up from -15.7 per cent to end-October.
|
C2 is an approximate measure of the size of the gross domestic debt of the general public (households, non-financial enterprises and municipalities) in NOK and foreign currency. Statistics Norway also compiles the credit indicator C3, which in addition to C2 (the public’s domestic gross debt) also includes the public’s external loan debt. Most of the public’s external loan debt refers to non-financial enterprises. The C3 statistics are published approximately one month later than the C2. |
|
Growth based on the three-month moving average is defined as growth in average outstanding credit (seasonally-adjusted figures) in the latest three-month period in relation to the previous three-month period. The growth is adjusted for exchange rate valuation changes and statistical breaks as an annualised figure. The calculation is centred; in other words, the observation is set at the middle month of the latest three-month period. |
Tables
The statistics is now published as Credit indicator.
Contact
-
Statistics Norway's Information Centre
E-mail: informasjon@ssb.no
tel.: (+47) 21 09 46 42