Content
Published:
This is an archived release.
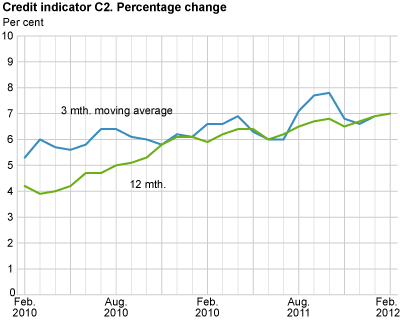
Continued increase in debt growth
The twelve-month growth in the credit indicator C2 was 7 per cent to end-February, up from 6.9 per cent to end-January. The increase in growth stems from households and non-financial enterprises.
|
C2 for March and April will be published 8 June. |
The general public’s gross domestic debt C2 amounted to NOK 3 896 billion at end-February, up from NOK 3 884 billion the previous month.
Increase in debt growth for non-financial enterprises
Non-financial enterprises’ gross domestic debt amounted to NOK 1 290 billion at end-January. The twelve-month growth was 6.4 per cent to end-February, up from 5.8 per cent to end-January. The growth based on the three-month moving average (annualised) of the non-financial gross debt increased to 8.5 per cent for the period December-February, compared with the previous three months when the three-month moving average was 7.3 per cent.
Increase in debt growth for households
Households’ gross domestic debt totalled NOK 2 279 billion at end-February. The twelve-month growth was 7.3 per cent to end-February, up2 from 7.2 per cent the previous month.
Decrease in debt growth for municipalities
Municipalities’ gross domestic debt totalled NOK 327 billion at end-February. The twelve-month growth was 7.7 per cent to end-February, down from 9 per cent to the previous month.
| September 2011 | October 2011 | November 2011 | December 2011 | January 2012 | February 2012 | ||||||||||||||||||||||||||||||||||||||||||||||||||||||||||||||||||||||||||
|---|---|---|---|---|---|---|---|---|---|---|---|---|---|---|---|---|---|---|---|---|---|---|---|---|---|---|---|---|---|---|---|---|---|---|---|---|---|---|---|---|---|---|---|---|---|---|---|---|---|---|---|---|---|---|---|---|---|---|---|---|---|---|---|---|---|---|---|---|---|---|---|---|---|---|---|---|---|---|---|
| 12 mth. total | 6.7 | 6.8 | 6.5 | 6.7 | 6.9 | 7.0 | |||||||||||||||||||||||||||||||||||||||||||||||||||||||||||||||||||||||||
| 3 mth. moving average total1 | 7.7 | 7.8 | 6.8 | 6.6 | 6.9 | ||||||||||||||||||||||||||||||||||||||||||||||||||||||||||||||||||||||||||
| 12 mth. households | 7.2 | 7.2 | 7.2 | 7.3 | 7.2 | 7.3 | |||||||||||||||||||||||||||||||||||||||||||||||||||||||||||||||||||||||||
| 12 mth. non-financial enterprises | 4.5 | 4.7 | 4.7 | 5.4 | 5.8 | 6.4 | |||||||||||||||||||||||||||||||||||||||||||||||||||||||||||||||||||||||||
| 1 | Annualised figure. |
Growth rates are affected by portfolio shifts
Of the general public’s gross domestic debt, 51.1 per cent consisted of bank loans. Bank loans amounted to NOK 1 989 billion, and the twelve-month growth in bank loans was 1.4 per cent to end-February. Mortgage companies’ loans amounted to NOK 1 253 billion at end-February and the twelve-month growth increased from 18.5 to 18.7 per cent. The growth rates are affected by transfers of loans from banks to mortgage companies. The growth rate for banks and mortgage companies in total was 7.5 per cent to end-February, up from 7.3 per cent the previous month.
Increase in certificate debt
The twelve-month growth rate in certificate debt was 23.4 per cent to end-February, up from 17.9 per cent the previous month. The twelve-month growth rate in the bond debt was -1.1 per cent to end-February, down from 0.6 per cent to end-January.
|
C2 is an approximate measure of the size of the gross domestic debt of the general public (households, non-financial enterprises and municipalities) in NOK and foreign currency. Statistics Norway also compiles the credit indicator C3, which in addition to C2 (the public’s domestic gross debt) also includes the public’s external loan debt. Most of the public’s external loan debt refers to non-financial enterprises. The C3 statistics are published approximately one month later than the C2. |
|
Growth based on the three-month moving average is defined as growth in average outstanding credit (seasonally-adjusted figures) in the latest three-month period in relation to the previous three-month period. The growth is adjusted for exchange rate valuation changes and statistical breaks as an annualised figure. The calculation is centred; in other words, the observation is set at the middle month of the latest three-month period. |
Revision of seasonally-adjusted figures:The seasonally-adjusted figures were revised in December 2011 with new seasonal components. For more information see “ Seasonal adjustment ”. |
| 2Corrected from "down" to "up" 2 April 2012 at 10.20 |
The statistics is now published as Credit indicator.
Contact
-
Statistics Norway's Information Centre
E-mail: informasjon@ssb.no
tel.: (+47) 21 09 46 42