Content
Published:
This is an archived release.
Debt growth unchanged
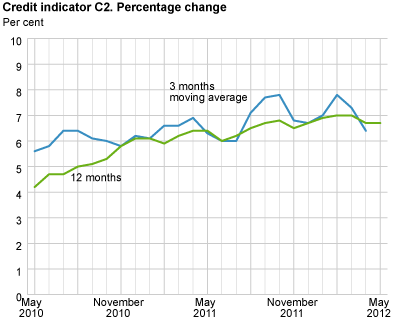
The twelve-month growth in the credit indicator C2 was 6.7 per cent to end-May, unchanged from the previous month.
The general public’s gross domestic debt C2 amounted to NOK 3 956 billion at end-May, up from NOK 3 922 billion the previous month.
Increase in debt growth for households
Households’ gross domestic debt totalled NOK 2 277 billion at end-May, up from NOK 2 256 billion the previous month. The twelve-month growth was 7.1 per cent to end-May, up from 6.8 per cent to end-April.
Decrease in debt growth for non-financial enterprises
Non-financial enterprises’ gross domestic debt amounted to NOK 1 348 billion at end-May, up from NOK 1 335 billion at end-April. The twelve-month growth was 6.0 per cent to end-May, down from 6.4 per cent the month before. The growth based on the three-month moving average (annualised) of the non-financial gross debt was 5.5 per cent for the period March-May.
Decrease in debt growth for municipalities
Municipalities’ gross domestic debt totalled NOK 331 billion at end-May, unchanged from the previous month. The twelve-month growth was 6.4 per cent to end-May, down from 7.5 per cent to end-April.
| December 2011 | January 2012 | February 2012 | March 2012 | April 2012 | May 2012 | ||||||||||||||||||||||||||||||||||||||||||||||||||||||||||||||||||||||||||
|---|---|---|---|---|---|---|---|---|---|---|---|---|---|---|---|---|---|---|---|---|---|---|---|---|---|---|---|---|---|---|---|---|---|---|---|---|---|---|---|---|---|---|---|---|---|---|---|---|---|---|---|---|---|---|---|---|---|---|---|---|---|---|---|---|---|---|---|---|---|---|---|---|---|---|---|---|---|---|---|
| 12 mth. total | 6.7 | 6.9 | 7.0 | 7.0 | 6.7 | 6.7 | |||||||||||||||||||||||||||||||||||||||||||||||||||||||||||||||||||||||||
| 3 mth. moving average tot.1 | 6.7 | 7.0 | 7.8 | 7.3 | 6.4 | ||||||||||||||||||||||||||||||||||||||||||||||||||||||||||||||||||||||||||
| 12 mth. households | 7.3 | 7.3 | 7.3 | 7.1 | 6.8 | 7.1 | |||||||||||||||||||||||||||||||||||||||||||||||||||||||||||||||||||||||||
| 12 mth. non-financial enterprises | 5.4 | 5.8 | 6.4 | 6.7 | 6.4 | 6.0 | |||||||||||||||||||||||||||||||||||||||||||||||||||||||||||||||||||||||||
| 1 | Annualised figure. |
Growth rates are affected by portfolio shifts
Of the general public’s gross domestic debt, 48.8 per cent consisted of bank loans. Bank loans amounted to NOK 1 994 billion at end-May, up from NOK 1 975 billion the previous month. The twelve-month growth in bank loans was 1.6 per cent to end-May, up from 0.6 per cent to end-April. Mortgage companies’ loans amounted to NOK 1 300 billion at end-May, up from NOK 1 289 billion at end-April. The twelve-month growth decreased from 19.3 per cent to end-April to 17.6 per cent to end-May. The growth rates are affected by transfers of loans from banks to mortgage companies. The growth rate for banks and mortgage companies in total was 7.4 per cent to end-May, up from 7.2 per cent the previous month.
Reduced growth in certificate debt
The twelve-month growth rate in certificate debt was 1.7 per cent to end-May, down from 14.2 per cent the previous month. The twelve-month growth rate in the bond debt was 3.6 per cent to end-May.
New institutional sector classificationThe Norwegian institutional sector classification was revised on 1 January 2012 in line with the international classification. This change entails a break in the statistics for the credit indicator (C2) from March 2012. As a result of the new classification, some enterprises that were previously classified as non-financial enterprises are now classified as financial enterprises. These enterprises are therefore no longer a part of “the general public”, and as such are not included in C2. In addition, some private quasi-unincorporated enterprises that were previously in the household sector are now classified as non-financial enterprises. Further, non-profit institutions serving households will be included in the household sector. The new sector classification will have an impact on the general public’s gross domestic debt, and the debt of households and non-financial enterprises. Based on data from the relevant enterprises, Statistics Norway has estimated and corrected transactions and growth rates. However, it should be noted that there is some uncertainty associated with the changes in sector classification between February 2012 and March 2012. For further information, see “ Institutional sector classification 2012 ” |
The statistics is now published as Credit indicator.
Contact
-
Statistics Norway's Information Centre
E-mail: informasjon@ssb.no
tel.: (+47) 21 09 46 42

