Content
Published:
This is an archived release.
Increase in total debt growth
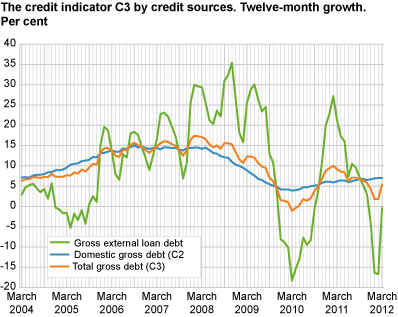
The twelve-month growth in total gross debt (C3) was 5.4 per cent to end-March, up from 1.8 per cent the previous month. The increase stemmed from foreign debt sources.
Total gross debt amounted to NOK 4 907 billion at end-March, up from NOK 4 783 billion at end-February.
Mainland Norway’s gross debt accounted for 86 per cent of the total gross debt at end-March. This amounted to NOK 4 223 billion at end-March, down from NOK 4 228 billion the previous month.
Increase in foreign debt
The general public gross foreign debt, which mainly relates to non-financial enterprises, amounted to NOK 1 000 billion at end-March, up from NOK 885 million the previous month. The twelve-month growth increased from -16.7 per cent to -0.4 per cent during March.
Mainland Norway accounted for 48 per cent of the public gross foreign debt, which amounted to NOK 482 billion. The twelve-month growth in mainland Norway’s foreign debt was -4.8 per cent to end-March, up from -15.1 per cent to end-February. The increase in mainland Norway’s foreign debt stemmed from both long-term and short-term debt.
Offshore industries accounted for the remainder of the foreign debt, and amounted to NOK 518 billion at end-March. The annual growth increased from -18.5 per cent the previous month to 4.4 per cent to end-March. The increase for the offshore industries stemmed mainly from short-term debt.
No change in domestic gross debt growth
The credit indicator (C2) amounted to NOK 3 907 billion at end-March. The twelve-month growth was 7 per cent to end-March, unchanged from end-February. The debt growth in non-financial enterprises was 6.6 per cent, while the growth in household debt was 7.1 per cent. The C2 statistics show that the annual growth in the general public domestic gross debt went down to 6.7 per cent to end-April.
| September 2011 | October 2011 | November 2011 | December 2011 | January 2012 | February 2012 | March 2012 | |||||||||||||||||||||||||||||||||||||||||||||||||||||||||||||||||||||||||
|---|---|---|---|---|---|---|---|---|---|---|---|---|---|---|---|---|---|---|---|---|---|---|---|---|---|---|---|---|---|---|---|---|---|---|---|---|---|---|---|---|---|---|---|---|---|---|---|---|---|---|---|---|---|---|---|---|---|---|---|---|---|---|---|---|---|---|---|---|---|---|---|---|---|---|---|---|---|---|---|
| Total gross debt (C3) | 6.8 | 6.4 | 5.8 | 4.3 | 1.8 | 1.8 | 5.4 | ||||||||||||||||||||||||||||||||||||||||||||||||||||||||||||||||||||||||
| Total gross loan debt, mainland-Norway | 5.3 | 5.2 | 4.1 | 4.9 | 4.2 | 4.2 | 5.7 | ||||||||||||||||||||||||||||||||||||||||||||||||||||||||||||||||||||||||
| Domestic gross debt (C2)1 | 6.7 | 6.8 | 6.5 | 6.7 | 6.9 | 7.0 | 7.0 | ||||||||||||||||||||||||||||||||||||||||||||||||||||||||||||||||||||||||
| Gross external loan debt | 7.2 | 5.2 | 3.0 | -4.4 | -16.4 | -16.7 | -0.4 | ||||||||||||||||||||||||||||||||||||||||||||||||||||||||||||||||||||||||
| Gross external loan debt, offshore ind. | 23.0 | 20.2 | 23.2 | -1.3 | -18.9 | -18.5 | 4.4 | ||||||||||||||||||||||||||||||||||||||||||||||||||||||||||||||||||||||||
| Gross ext. loan debt, mainland-Norway | -4.5 | -6.1 | -11.8 | -6.9 | -14.4 | -15.1 | -4.8 | ||||||||||||||||||||||||||||||||||||||||||||||||||||||||||||||||||||||||
| 1 | The growth rates for C2 are in the table presented as they were at the time of the C3 release. |
New institutional sector classificationThe Norwegian institutional sector classification was revised on 1 January 2012 in line with the international classification. This change entails a break in the statistics for the credit indicator (C3) from March 2012. As a result of the new classification, some enterprises that were previously classified as non-financial enterprises are now classified as financial enterprises. These enterprises are therefore no longer a part of “the general public”, and as such are not included in C3. Based on data from the relevant enterprises, Statistics Norway has estimated and corrected transactions and growth rates. However, it should be noted that there is some uncertainty associated with the changes in sector classification between February 2012 and March 2012. For further information, see “ Institutional sector classification 2012 ”. |
The statistics is now published as Credit indicator.
Contact
-
Statistics Norway's Information Centre
E-mail: informasjon@ssb.no
tel.: (+47) 21 09 46 42

