Content
Published:
This is an archived release.
Decrease in total debt growth
The twelve-month growth in total gross debt (C3) was 4.9 per cent to end-September, down from 5.2 per cent the previous month. The decrease stemmed from both domestic and foreign debt sources.
Total gross debt amounted to NOK 5 036 billion at end-September, up from NOK 5 026 billion at end-September.
Mainland Norway’s gross debt accounted for 87 per cent of the total gross debt at end-September. This amounted to NOK 4 385 billion at end-September, up from NOK 4 372 billion the previous month.
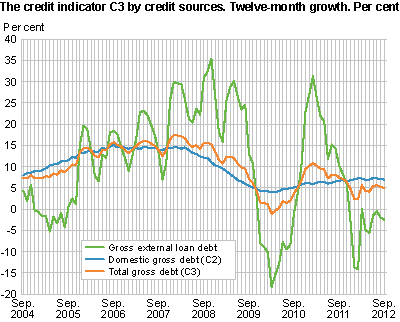
Decrease in foreign debt
The general public gross foreign debt, which mainly relates to non-financial enterprises, amounted to NOK 1 001 billion at end-September, down from NOK 1 012 billion the previous month. The twelve-month growth decreased from -2.0 per cent to end-August to -2.5 per cent to end-September.
Mainland Norway accounted for 53 per cent of the public gross foreign debt, which amounted to NOK 529 billion at end-September. The twelve-month growth in mainland Norway’s foreign debt was -0.9 per cent to end-September, down from 1.3 per cent to end-August. The increase in mainland Norway’s foreign debt stemmed from both short-term and long-term debt.
Offshore industries accounted for the remainder of the foreign debt, which amounted to NOK 472 billion at end-September. The annual growth was -4.3 per cent to end-September, up from -5.6 per cent to end-August. The increase in annual growth rate for the offshore industries stemmed from both short-term and long-term debt.
Decrease in domestic gross debt growth
The credit indicator (C2) amounted to NOK 4 034 billion at end-September. The twelve-month growth was 6.9 per cent to end-September, down from 7.1 per cent the previous month. The debt growth in non-financial enterprises was 6.6 per cent, while the growth in household debt was 7.0 per cent. The C2 statistics show that the annual growth in the general public domestic gross debt was unchanged at 6.9 per cent to end-October.
| March 2012 | April 2012 | May 2012 | June 2012 | July 2012 | August 2012 | September 2012 | |||||||||||||||||||||||||||||||||||||||||||||||||||||||||||||||||||||||||
|---|---|---|---|---|---|---|---|---|---|---|---|---|---|---|---|---|---|---|---|---|---|---|---|---|---|---|---|---|---|---|---|---|---|---|---|---|---|---|---|---|---|---|---|---|---|---|---|---|---|---|---|---|---|---|---|---|---|---|---|---|---|---|---|---|---|---|---|---|---|---|---|---|---|---|---|---|---|---|---|
| Total gross debt (C3) | 5.6 | 4.2 | 4.1 | 5.4 | 5.6 | 5.2 | 4.9 | ||||||||||||||||||||||||||||||||||||||||||||||||||||||||||||||||||||||||
| Total gross loan debt, mainland-Norway | 6.4 | 6.3 | 5.9 | 6.0 | 6.1 | 6.2 | 5.7 | ||||||||||||||||||||||||||||||||||||||||||||||||||||||||||||||||||||||||
| Domestic gross debt (C2)1 | 7.2 | 6.9 | 6.9 | 7.3 | 7.2 | 7.1 | 6.9 | ||||||||||||||||||||||||||||||||||||||||||||||||||||||||||||||||||||||||
| Gross external loan debt | 0.0 | -5.0 | -5.6 | -1.5 | -0.5 | -2.0 | -2.5 | ||||||||||||||||||||||||||||||||||||||||||||||||||||||||||||||||||||||||
| Gross external loan debt, offshore ind. | -0.8 | -13.4 | -11.4 | -2.6 | -1.7 | -5.6 | -4.3 | ||||||||||||||||||||||||||||||||||||||||||||||||||||||||||||||||||||||||
| Gross ext. loan debt, mainland-Norway | 0.7 | 2.5 | -0.5 | -0.5 | 0.6 | 1.3 | -0.9 | ||||||||||||||||||||||||||||||||||||||||||||||||||||||||||||||||||||||||
| 1 | The growth rates for C2 are in the table presented as they were at the time of the C3 release. |
Introduction of new financial arrangementThe state-owned company Export Credit Norway AS was established on 25 June 2012 to facilitate loans to non-financial enterprises. The loan facilitating activity began in December 2011. Data have been revised and the growth rate for the public’s gross domestic debt, C2, has been adjusted upwards for the period December 2011-August 2012. |
RevisionsIn connection with the publication of K3 data for September 2012, a comprehensive revision of the foreign debt’s basis of figures was undertaken. The changes primarily apply to a change in the base year affecting weighting of monthly figures, and inclusion of new enterprises with foreign debt figures from December 2010. The revision relates to the period December 2010-September 2012. For more details concerning sampling, see section 3.3 in About the statistics . |
The statistics is now published as Credit indicator.
Contact
-
Statistics Norway's Information Centre
E-mail: informasjon@ssb.no
tel.: (+47) 21 09 46 42