Content
Published:
This is an archived release.
Increased money supply growth
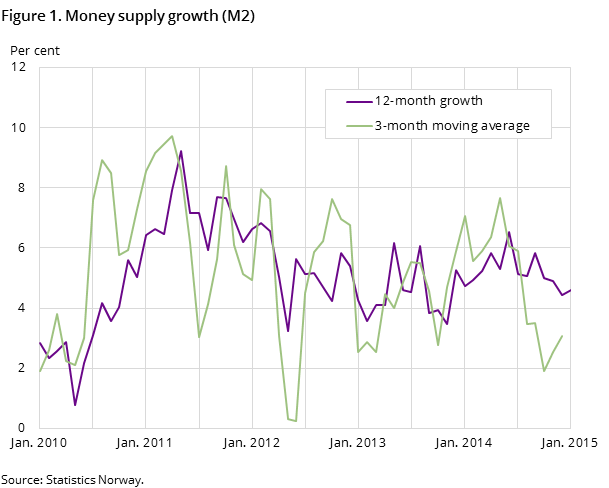
The twelve-month growth in total money supply (M2) was 4.6 per cent to end-January 2015, up from 4.4 per cent the previous month.
| August 2014 | September 2014 | October 2014 | November 2014 | December 2014 | January 2015 | |
|---|---|---|---|---|---|---|
| 12-month growth, M2 | 5.1 | 5.8 | 5.0 | 4.9 | 4.4 | 4.6 |
| 3-month moving average, M2 | 3.5 | 3.5 | 1.9 | 2.5 | 3.1 | .. |
| 12-month growth, households, M2 | 6.4 | 6.4 | 6.3 | 6.8 | 7.2 | 7.1 |
| 12-month growth, non-financial corporations, M2 | 3.9 | 5.5 | 5.3 | 4.2 | 4.1 | 3.5 |

The total money supply amounted to NOK 1 999 billion at end-January this year, up from NOK 1 981 billion at end-December 2014.
Decreasing growth in money supply for households
Households’ money supply constitutes more than half of the total money supply. At end-January it accounted for NOK 1 113 billion, up from NOK 1 109 billion at end-December. The twelve-month growth in households’ money supply was 7.1 per cent to end-January, marginally down from 7.2 per cent the previous month.
The growth in households’ money supply was higher than the growth in households’ gross domestic debt, which amounted to 6.2 per cent to end-January according to the credit indicator C2.
Decreased growth of money supply for non-financial corporations
Non-financial corporations’ money supply amounted to NOK 636 billion at end-January, up from NOK 626 billion at end-December. The twelve-month growth was 3.5 per cent to end-January, down from 4.1 per cent the previous month. Non-financial corporations’ money supply constituted 32 per cent of the total money supply at end-January.
Increasing money supply growth for municipal government
Municipal government’s money supply amounted to NOK 67 billion at end-January, down from NOK 69 billion the previous month. The twelve-month growth rate was 4.7 per cent to end-January, up from -2.2 per cent to end-December.
Increased money supply growth for other financial corporations
Other financial corporations’ money supply amounted to NOK 183 billion at end-January, up from NOK 177 billion at the end of the previous month. The twelve-month growth was -5.3 per cent to end-January, up from -7.5 per cent the previous month.
Steady composition of money supply
The composition of the money supply remains steady. The broad monetary aggregate M2 amounted to NOK 1 999 billion at end-January, of which the major part, 94 per cent, consisted of bank deposits. In comparison, notes and coins accounted for 2.3 per cent. The rest of the broad monetary aggregate consisted of shares in money market funds and certificates of deposits, which accounted for 3.3 and 0.2 per cent respectively.
Increased growth in base money
Base money (M0) amounted to NOK 137 billion at the end of January, up from NOK 131 billion at the end of December. The twelve-month growth in M0 was at 2.6 per cent to end-January, up from 1.6 per cent the previous month.
Revision of seasonally adjusted figuresOpen and readClose
The seasonally adjusted figures are revised with new seasonal components. For more information see “About seasonal adjustment”.
The statistics is published with Monetary aggregates.
Contact
-
Statistics Norway's Information Centre
E-mail: informasjon@ssb.no
tel.: (+47) 21 09 46 42
