Content
Published:
This is an archived release.
Households opt for floating interest loans
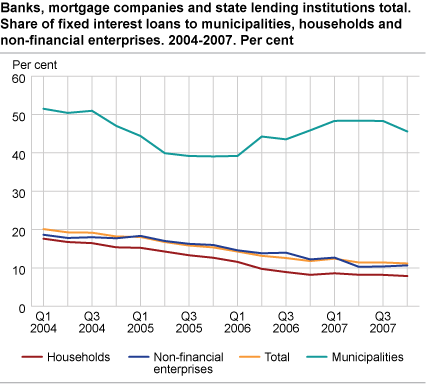
The share of loans with fixed interest to households has decreased from nearly 18 per cent in 2004 to only 7.9 per cent in the fourth quarter of 2007. The share of fixed interest loans to the general public was 11.2 per cent in the fourth quarter, a small decrease from the third quarter.
From the first quarter of 2004 to the end of 2006, the share of fixed interest rate loans of total loans to the general public (non-financial corporations, municipalities and households) decreased steadily from 20 per cent to 11.8 per cent. In the first quarter of 2007, this figure increased slightly, but fell again in the second quarter. In the fourth quarter of 2007, 11.2 per cent of total loans to the general public were loans with fixed interest rate. This is a decrease of 0.25 percentage points from the previous quarter.
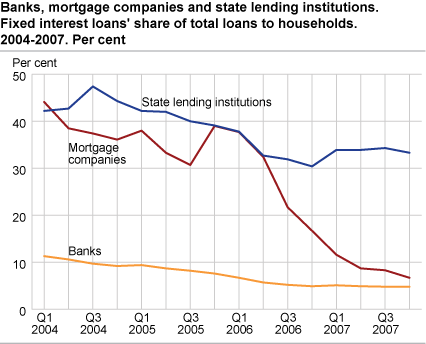
The statistics include all loans to banks, mortgage companies and state lending institutions. When comparing the different creditor sectors’ share of fixed interest rate loans to the general public, it is evident that the banks’ share has fallen in all quarters before it levelled out in the third quarter of 2007. Figures for the fourth quarter, however, show a marginal increase to 5.7 per cent.
Lower share of fixed interest loans
Mortgage companies’ share of fixed interest loans has decreased in most quarters since 2004. In the fourth quarter of 2007, this share decreased by 3.6 per cent to barely 30 per cent. Transfer of loan portfolios with floating interest from banks to mortgage companies in the same banking group is an important reason for this.
State lending institutions still have a relatively high share of fixed interest loans to the general public. The share has increased somewhat in the preceding quarters, but figures for the fourth quarter show a small decrease of 1.1 percentage points, resulting in a share of fixed interest loans of 35 per cent in the fourth quarter of 2007.
| Quarter | Banks | Mortgage companies | State lending institutions | ||||||||||||||||||||||||||||||||||||
|---|---|---|---|---|---|---|---|---|---|---|---|---|---|---|---|---|---|---|---|---|---|---|---|---|---|---|---|---|---|---|---|---|---|---|---|---|---|---|---|
|
Less than
1 year |
1 to 5 years |
More than
5 years |
Total |
Less than
1 year |
1 to 5 years |
More than
5 years |
Total |
Less than
1 year |
1 to 5 years |
More than
5 years |
Total | ||||||||||||||||||||||||||||
| Q1 2004 | 2.0 | 8.8 | 0.6 | 11.3 | 13.4 | 21.8 | 9.0 | 44.1 | 4.3 | 37.9 | 0.0 | 42.2 | |||||||||||||||||||||||||||
| Q2 2004 | 1.6 | 8.5 | 0.6 | 10.6 | 11.7 | 19.5 | 7.3 | 38.5 | 4.5 | 38.2 | 0.0 | 42.7 | |||||||||||||||||||||||||||
| Q3 2004 | 1.4 | 7.8 | 0.5 | 9.7 | 11.2 | 19.1 | 7.1 | 37.4 | 5.4 | 42.0 | 0.0 | 47.4 | |||||||||||||||||||||||||||
| Q4 2004 | 1.6 | 7.2 | 0.5 | 9.2 | 11.8 | 16.2 | 8.1 | 36.1 | 4.0 | 40.4 | 0.0 | 44.3 | |||||||||||||||||||||||||||
| Q1 2005 | 2.0 | 6.8 | 0.5 | 9.4 | 14.2 | 15.7 | 8.1 | 38.0 | 8.6 | 33.5 | 0.0 | 42.2 | |||||||||||||||||||||||||||
| Q2 2005 | 2.7 | 5.5 | 0.5 | 8.7 | 11.1 | 15.0 | 7.3 | 33.3 | 9.9 | 32.0 | 0.0 | 42.0 | |||||||||||||||||||||||||||
| Q3 2005 | 3.2 | 4.5 | 0.5 | 8.2 | 11.7 | 12.2 | 6.7 | 30.7 | 9.6 | 30.4 | 0.0 | 40.0 | |||||||||||||||||||||||||||
| Q4 2005 | 2.9 | 4.1 | 0.6 | 7.6 | 16.7 | 14.6 | 7.7 | 39.0 | 8.6 | 30.5 | 0.0 | 39.1 | |||||||||||||||||||||||||||
| Q1 2006 | 2.2 | 3.9 | 0.5 | 6.7 | 17.1 | 12.9 | 7.7 | 37.7 | 9.2 | 28.6 | 0.0 | 37.8 | |||||||||||||||||||||||||||
| Q2 2006 | 1.5 | 3.6 | 0.6 | 5.7 | 15.5 | 10.4 | 6.4 | 32.4 | 3.9 | 28.8 | 0.0 | 32.7 | |||||||||||||||||||||||||||
| Q3 2006 | 1.3 | 3.4 | 0.5 | 5.2 | 10.3 | 7.3 | 4.2 | 21.7 | 3.4 | 28.5 | 0.0 | 31.9 | |||||||||||||||||||||||||||
| Q4 2006 | 1.4 | 2.9 | 0.7 | 4.9 | 4.7 | 7.3 | 4.8 | 16.7 | 3.0 | 27.4 | 0.0 | 30.4 | |||||||||||||||||||||||||||
| Q1 2007 | 1.5 | 2.9 | 0.8 | 5.1 | 3.3 | 5.0 | 3.3 | 11.6 | 1.4 | 32.5 | 0.0 | 33.9 | |||||||||||||||||||||||||||
| Q2 2007 | 1.5 | 2.6 | 0.8 | 4.9 | 2.5 | 4.0 | 2.2 | 8.7 | 1.7 | 32.2 | 0.0 | 33.9 | |||||||||||||||||||||||||||
| Q3 2007 | 1.6 | 2.4 | 0.7 | 4.8 | 3.0 | 3.3 | 2.1 | 8.3 | 3.9 | 30.5 | 0.0 | 34.3 | |||||||||||||||||||||||||||
| Q4 2007 | 1.5 | 2.5 | 0.7 | 4.8 | 3.0 | 2.3 | 1.5 | 6.7 | 9.6 | 23.6 | 0.0 | 33.3 | |||||||||||||||||||||||||||
Falling share of fixed interest loans to households
In the second and third quarter of 2007, the share of fixed interest loans to households has been 8.2 per cent, compared with almost 18 per cent in the first quarter of 2004. In the fourth quarter of 2007, the share fell further to 7.9 per cent. The share of fixed interest loans from banks to households was unaltered at 4.8 per cent from the third quarter, compared with a decrease of 1 percentage point for state lending institutions. The mortgage companies’ share of loans with fixed interest to households was only 6.7 per cent in the fourth quarter of 2007. This is a decrease of 37 percentage points compared to the first quarter of 2004 and 1.6 percentage point compared to the third quarter of 2007. The figures for mortgage companies and state lending institutions also indicate a further decrease in the share of fixed interest loans because an increasing share of loans have a fixed interest period shorter than one year.
Fixed loans to local government decrease
The share of fixed interest loans to local government is high and has remained stable at 48 per cent in the last three quarters. However, in the fourth quarter of 2007 the share decreased by 2 percentage points to 46 per cent. As in the third quarter, the share of fixed interest loans to non-financial corporations increased marginally to 11 per cent in the fourth quarter of 2007.
The statistics is now published as Interest rates in banks and mortgage companies.
Additional information
This statistics show loans broken down by the remaining fixed interest rate period. The fixed interest rate period is measured as the time from the end of the reported period to the next interest rate regulation. Differences between figures in the text and the tables due to rounding off may occur.
Contact
-
Statistics Norway's Information Centre
E-mail: informasjon@ssb.no
tel.: (+47) 21 09 46 42


