Content
Published:
This is an archived release.
Continued low share of fixed-rate loans
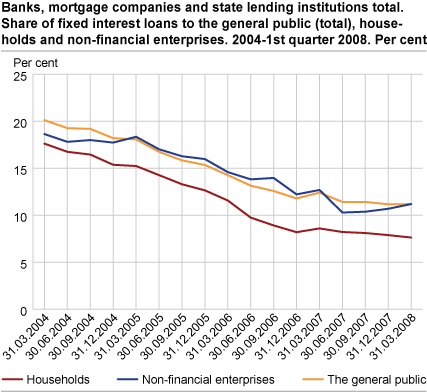
The share of fixed-rate loans to households has fallen from nearly 18 per cent in 2004 to 7.6 per cent in the first quarter of 2008. For loans to non-financial corporations, the share of fixed-interest loans is 11.2 per cent.
From the first quarter of 2004 to the end of 2007, financial enterprises’ share of fixed-rate loans in relation to all loans to the general public (non-financial corporations, municipalities and households) decreased steadily from 20 per cent to 11.2 per cent. This figure remained unchanged in the first quarter of 2008.
Share of fixed-rate loans to households continues to decrease
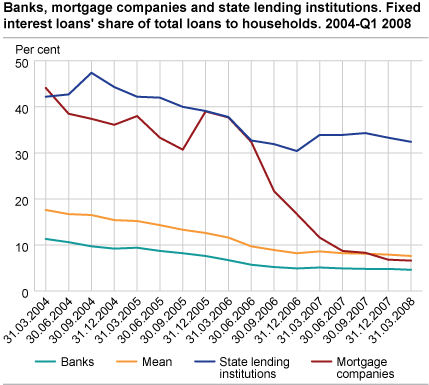
Apart from the first quarter of 2007, the share of fixed-rate loans to households has decreased in every quarter since the statistics were first published. In the first quarter of 2004, the share was 17.6 per cent, compared with 7.6 per cent in the first quarter of 2008. The share of fixed-rate loans to households from banks, mortgage companies and state lending institutions all fell, and the share is now 4.6, 6.6 and 32.2 per cent respectively.
Loans to households with fixed interest rate for more than five years increased by NOK 2.1 billion and amounted to NOK 13.9 billion at the end of the first quarter. This represents 0.8 per cent of total loans to households.
The fixed interest share of mortgage companies’ loans to households continues to fall and was 6.6 per cent at the end of the first quarter. This is a 37 per cent decrease from the first quarter of 2004. The transfer of loan portfolios with floating interest from banks to mortgage companies in the same banking group is one important reason for this.
| Quarter | Banks | Mortgage companies | State lending institutions | Mean | |||||||||||||||||||||||||||||||||||
|---|---|---|---|---|---|---|---|---|---|---|---|---|---|---|---|---|---|---|---|---|---|---|---|---|---|---|---|---|---|---|---|---|---|---|---|---|---|---|---|
|
Less than
1 year |
1 to 5 years |
More than
5 years |
Total |
Less than
1 year |
1 to 5 years |
More than
5 years |
Total |
Less than
1 year |
1 to 5 years |
More than
5 years |
Total |
Less than
1 year |
1 to 5 years |
More than
5 years |
Total | ||||||||||||||||||||||||
| Q1 2004 | 2.0 | 8.8 | 0.6 | 11.3 | 13.4 | 21.8 | 9.0 | 44.1 | 4.3 | 37.9 | 0.0 | 42.2 | 2.9 | 13.8 | 0.9 | 17.6 | |||||||||||||||||||||||
| Q2 2004 | 1.6 | 8.5 | 0.6 | 10.6 | 11.7 | 19.5 | 7.3 | 38.5 | 4.5 | 38.2 | 0.0 | 42.7 | 2.5 | 13.4 | 0.9 | 16.7 | |||||||||||||||||||||||
| Q3 2004 | 1.4 | 7.8 | 0.5 | 9.7 | 11.2 | 19.1 | 7.1 | 37.4 | 5.4 | 42.0 | 0.0 | 47.4 | 2.5 | 13.2 | 0.8 | 16.5 | |||||||||||||||||||||||
| Q4 2004 | 1.6 | 7.2 | 0.5 | 9.2 | 11.8 | 16.2 | 8.1 | 36.1 | 4.0 | 40.4 | 0.0 | 44.3 | 2.4 | 12.2 | 0.8 | 15.4 | |||||||||||||||||||||||
| Q1 2005 | 2.0 | 6.8 | 0.5 | 9.4 | 14.2 | 15.7 | 8.1 | 38.0 | 8.6 | 33.5 | 0.0 | 42.2 | 3.5 | 10.8 | 0.9 | 15.2 | |||||||||||||||||||||||
| Q2 2005 | 2.7 | 5.5 | 0.5 | 8.7 | 11.1 | 15.0 | 7.3 | 33.3 | 9.9 | 32.0 | 0.0 | 42.0 | 4.1 | 9.4 | 0.8 | 14.3 | |||||||||||||||||||||||
| Q3 2005 | 3.2 | 4.5 | 0.5 | 8.2 | 11.7 | 12.2 | 6.7 | 30.7 | 9.6 | 30.4 | 0.0 | 40.0 | 4.4 | 8.2 | 0.7 | 13.3 | |||||||||||||||||||||||
| Q4 2005 | 2.9 | 4.1 | 0.6 | 7.6 | 16.7 | 14.6 | 7.7 | 39.0 | 8.6 | 30.5 | 0.0 | 39.1 | 4.1 | 7.8 | 0.8 | 12.6 | |||||||||||||||||||||||
| Q1 2006 | 2.2 | 3.9 | 0.5 | 6.7 | 17.1 | 12.9 | 7.7 | 37.7 | 9.2 | 28.6 | 0.0 | 37.8 | 3.6 | 7.3 | 0.7 | 11.6 | |||||||||||||||||||||||
| Q2 2006 | 1.5 | 3.6 | 0.6 | 5.7 | 15.5 | 10.4 | 6.4 | 32.4 | 3.9 | 28.8 | 0.0 | 32.7 | 2.2 | 6.8 | 0.7 | 9.7 | |||||||||||||||||||||||
| Q3 2006 | 1.3 | 3.4 | 0.5 | 5.2 | 10.3 | 7.3 | 4.2 | 21.7 | 3.4 | 28.5 | 0.0 | 31.9 | 1.9 | 6.4 | 0.6 | 8.9 | |||||||||||||||||||||||
| Q4 2006 | 1.4 | 2.9 | 0.7 | 4.9 | 4.7 | 7.3 | 4.8 | 16.7 | 3.0 | 27.4 | 0.0 | 30.4 | 1.7 | 5.8 | 0.7 | 8.2 | |||||||||||||||||||||||
| Q1 2007 | 1.5 | 2.9 | 0.8 | 5.1 | 3.3 | 5.0 | 3.3 | 11.6 | 1.4 | 32.5 | 0.0 | 33.9 | 1.6 | 6.2 | 0.8 | 8.6 | |||||||||||||||||||||||
| Q2 2007 | 1.5 | 2.6 | 0.8 | 4.9 | 2.5 | 4.0 | 2.2 | 8.7 | 1.7 | 32.2 | 0.0 | 33.9 | 1.6 | 5.8 | 0.8 | 8.2 | |||||||||||||||||||||||
| Q3 2007 | 1.6 | 2.4 | 0.7 | 4.8 | 3.0 | 3.3 | 2.1 | 8.3 | 3.9 | 30.5 | 0.0 | 34.3 | 2.0 | 5.4 | 0.7 | 8.1 | |||||||||||||||||||||||
| Q4 2007 | 1.5 | 2.5 | 0.7 | 4.8 | 3.0 | 2.3 | 1.5 | 6.8 | 9.6 | 23.6 | 0.0 | 33.3 | 2.5 | 4.7 | 0.7 | 7.9 | |||||||||||||||||||||||
| Q1 2008 | 1.3 | 2.5 | 0.7 | 4.6 | 2.3 | 1.7 | 2.6 | 6.6 | 9.6 | 22.8 | 0.0 | 32.4 | 2.3 | 4.5 | 0.8 | 7.6 | |||||||||||||||||||||||
Local government chooses fixed interest rate
The share of fixed-rate loans to local government is high and has remained between 40 and 50 per cent since 2004. In the first quarter of 2008, the share was 46.3 per cent. This was a small increase from the previous quarter.
More fixed-rate loans to non-financial corporations
The share of fixed-rate loans to non-financial corporations increased by 0.5 percentage points to 11.2 per cent in the first quarter of 2008. Loans with fixed interest for more than five years to non-financial corporations increased by NOK 2.5 billion in the same period and now represent 1.6 per cent of total loans to this sector.
Higher fixed-rate share on loans from banks, lower for mortgage companies
The statistics include all loans from banks, mortgage companies and state lending institutions. When comparing the different creditor sectors’ share of fixed-rate loans to the general public, it is evident that the banks’ share has fallen in every quarter before levelling out in the third quarter of 2007. Figures for the fourth quarter, however, showed a marginal increase and in the first quarter of 2008 the share increased further to 5.8 per cent.
Mortgage companies’ share of fixed-rate loans has decreased in almost every quarter since 2004. In the fourth quarter of 2007, this share decreased by 3.6 per cent to barely 30 per cent, while the share fell by another percentage point in the first quarter of 2008. State lending institutions still account for a relatively high share of fixed-rate loans to the general public. The share has been relatively stable in recent quarters, and is now about 34 per cent.
The statistics is now published as Interest rates in banks and mortgage companies.
Additional information
This statistics show loans broken down by the remaining fixed interest rate period. The fixed interest rate period is measured as the time from the end of the reported period to the next interest rate regulation. Differences between figures in the text and the tables due to rounding off may occur.
Contact
-
Statistics Norway's Information Centre
E-mail: informasjon@ssb.no
tel.: (+47) 21 09 46 42


