Content
Published:
This is an archived release.
Still moderate demand for fixed interest rate loans
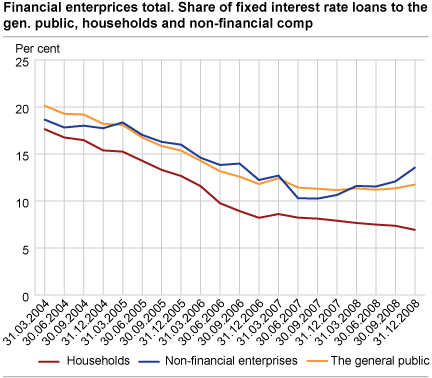
There was a modest increase in the share of loans with fixed interest rate to the general public in the fourth quarter of 2008. The fixed interest rate share increased on loans to non-financial companies and fell on loans to households.
Even though there was a large decline in the interest rate level on fixed interest rate loans at the end of 2008, most households and non-financial companies still choose floating interest rate on their loans. The financial enterprises’ share of fixed interest rate loans of total loans to the general public increased by 0.4 percentage points, to 11.7 per cent, in the fourth quarter of 2008. This is 0.6 higher than in the fourth quarter of 2007. The share of fixed interest rate loans, of total loans to non-financial companies, increased from 12 to 13.5 per cent, while the share of fixed interest rate loans of total loans to households fell from 7.3 to 6.9 percent in the same period. The share of fixed interest rate loans of total loans to local government increased from 48.5 to 50.2 per cent.
Continued decline in the share of fixed rate loans to households
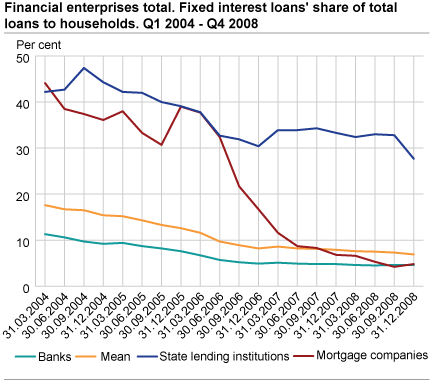
Apart from the first quarter of 2007, the share of fixed interest loans to households have decreased in all quarters since these statistics started. The fall from quarter three to quarter four 2008 is mainly due to the decline in the share of fixed rate loans from state lending institutions to households, from 32.2 to 27.8 per cent. The corresponding share of fixed rate loans from banks remained stable at 4.6 per cent, while there was an increase in the share of fixed rate loans from mortgage companies to households, from 4.2 to 4.8 per cent.
The decrease in the share of fixed rate loans from state lending institutions to households are partly explained by the fact that some borrowers have chosen to switch to floating interest rates when their previous fixed term loan agreements are up for negotiation. There is an increase in the share of fixed interest rate loans from mortgage companies despite of portfolio movements of housing loans with floating interest rates from banks to mortgage companies. Such portfolio movements have become more and more prevalent after the Norwegian Governments first actions against the financial crisis ("Bankpakke 1").
The share of fixed rate loans with less than one year remaining maturity from the state lending institutions fell from 12.3 to 7.6 per cent, while there was a small increase for loans with less than one year remaining maturity from banks and mortgage companies.
| Quarter | Banks | Mortgage companies | State lending institutions | Mean | |||||||||||||||||||||||||||||||||||
|---|---|---|---|---|---|---|---|---|---|---|---|---|---|---|---|---|---|---|---|---|---|---|---|---|---|---|---|---|---|---|---|---|---|---|---|---|---|---|---|
|
Less than
1 year |
1 to 5 years |
More than
5 years |
Total |
Less than
1 year |
1 to 5 years |
More than
5 years |
Total |
Less than
1 year |
1 to 5 years |
More than
5 years |
Total |
Less than
1 year |
1 to 5 years |
More than
5 years |
Total | ||||||||||||||||||||||||
| Q1 2004 | 2.0 | 8.8 | 0.6 | 11.3 | 13.4 | 21.8 | 9.0 | 44.1 | 4.3 | 37.9 | 0.0 | 42.2 | 2.9 | 13.8 | 0.9 | 17.6 | |||||||||||||||||||||||
| Q2 2004 | 1.6 | 8.5 | 0.6 | 10.6 | 11.7 | 19.5 | 7.3 | 38.5 | 4.5 | 38.2 | 0.0 | 42.7 | 2.5 | 13.4 | 0.9 | 16.7 | |||||||||||||||||||||||
| Q3 2004 | 1.4 | 7.8 | 0.5 | 9.7 | 11.2 | 19.1 | 7.1 | 37.4 | 5.4 | 42.0 | 0.0 | 47.4 | 2.5 | 13.2 | 0.8 | 16.5 | |||||||||||||||||||||||
| Q4 2004 | 1.6 | 7.2 | 0.5 | 9.2 | 11.8 | 16.2 | 8.1 | 36.1 | 4.0 | 40.4 | 0.0 | 44.3 | 2.4 | 12.2 | 0.8 | 15.4 | |||||||||||||||||||||||
| Q1 2005 | 2.0 | 6.8 | 0.5 | 9.4 | 14.2 | 15.7 | 8.1 | 38.0 | 8.6 | 33.5 | 0.0 | 42.2 | 3.5 | 10.8 | 0.9 | 15.2 | |||||||||||||||||||||||
| Q2 2005 | 2.7 | 5.5 | 0.5 | 8.7 | 11.1 | 15.0 | 7.3 | 33.3 | 9.9 | 32.0 | 0.0 | 42.0 | 4.1 | 9.4 | 0.8 | 14.3 | |||||||||||||||||||||||
| Q3 2005 | 3.2 | 4.5 | 0.5 | 8.2 | 11.7 | 12.2 | 6.7 | 30.7 | 9.6 | 30.4 | 0.0 | 40.0 | 4.4 | 8.2 | 0.7 | 13.3 | |||||||||||||||||||||||
| Q4 2005 | 2.9 | 4.1 | 0.6 | 7.6 | 16.7 | 14.6 | 7.7 | 39.0 | 8.6 | 30.5 | 0.0 | 39.1 | 4.1 | 7.8 | 0.8 | 12.6 | |||||||||||||||||||||||
| Q1 2006 | 2.2 | 3.9 | 0.5 | 6.7 | 17.1 | 12.9 | 7.7 | 37.7 | 9.2 | 28.6 | 0.0 | 37.8 | 3.6 | 7.3 | 0.7 | 11.6 | |||||||||||||||||||||||
| Q2 2006 | 1.5 | 3.6 | 0.6 | 5.7 | 15.5 | 10.4 | 6.4 | 32.4 | 3.9 | 28.8 | 0.0 | 32.7 | 2.2 | 6.8 | 0.7 | 9.7 | |||||||||||||||||||||||
| Q3 2006 | 1.3 | 3.4 | 0.5 | 5.2 | 10.3 | 7.3 | 4.2 | 21.7 | 3.4 | 28.5 | 0.0 | 31.9 | 1.9 | 6.4 | 0.6 | 8.9 | |||||||||||||||||||||||
| Q4 2006 | 1.4 | 2.9 | 0.7 | 4.9 | 4.7 | 7.3 | 4.8 | 16.7 | 3.0 | 27.4 | 0.0 | 30.4 | 1.7 | 5.8 | 0.7 | 8.2 | |||||||||||||||||||||||
| Q1 2007 | 1.5 | 2.9 | 0.8 | 5.1 | 3.3 | 5.0 | 3.3 | 11.6 | 1.4 | 32.5 | 0.0 | 33.9 | 1.6 | 6.2 | 0.8 | 8.6 | |||||||||||||||||||||||
| Q2 2007 | 1.5 | 2.6 | 0.8 | 4.9 | 2.5 | 4.0 | 2.2 | 8.7 | 1.7 | 32.2 | 0.0 | 33.9 | 1.6 | 5.8 | 0.8 | 8.2 | |||||||||||||||||||||||
| Q3 2007 | 1.6 | 2.4 | 0.7 | 4.8 | 3.0 | 3.3 | 2.1 | 8.3 | 3.9 | 30.5 | 0.0 | 34.3 | 2.0 | 5.4 | 0.7 | 8.1 | |||||||||||||||||||||||
| Q4 2007 | 1.5 | 2.5 | 0.7 | 4.8 | 3.0 | 2.3 | 1.5 | 6.8 | 9.6 | 23.6 | 0.0 | 33.3 | 2.5 | 4.7 | 0.7 | 7.9 | |||||||||||||||||||||||
| Q1 2008 | 1.4 | 2.5 | 0.7 | 4.7 | 2.3 | 1.7 | 2.6 | 6.6 | 9.6 | 22.8 | 0.0 | 32.4 | 2.3 | 4.5 | 0.8 | 7.6 | |||||||||||||||||||||||
| Q2 2008 | 1.2 | 2.6 | 0.7 | 4.5 | 1.6 | 1.3 | 2.3 | 5.2 | 12.7 | 20.3 | 0.0 | 33.0 | 2.4 | 4.2 | 0.8 | 7.5 | |||||||||||||||||||||||
| Q3 2008 | 1.1 | 2.8 | 0.7 | 4.6 | 1.1 | 1.2 | 1.9 | 4.2 | 12.3 | 20.5 | 0.0 | 32.8 | 2.2 | 4.3 | 0.9 | 7.3 | |||||||||||||||||||||||
| Q4 2008 | 1.3 | 2.6 | 0.6 | 4.6 | 1.3 | 1.7 | 1.8 | 4.8 | 7.6 | 20.1 | 0.1 | 27.7 | 1.9 | 4.2 | 0.8 | 6.9 | |||||||||||||||||||||||
The statistics is now published as Interest rates in banks and mortgage companies.
Additional information
This statistics show loans broken down by the remaining fixed interest rate period. The fixed interest rate period is measured as the time from the end of the reported period to the next interest rate regulation. Differences between figures in the text and the tables due to rounding off may occur.
Contact
-
Statistics Norway's Information Centre
E-mail: informasjon@ssb.no
tel.: (+47) 21 09 46 42


