Content
Published:
This is an archived release.
Mutual funds reach record levels
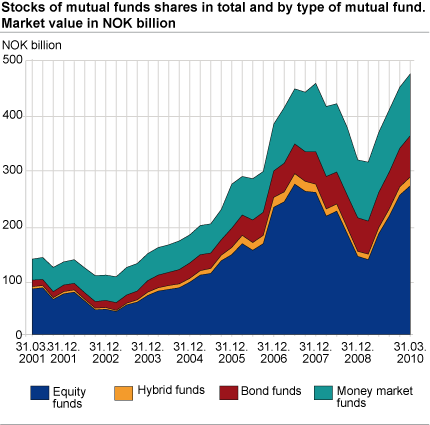
At the end of the first quarter of 2010, the total value of shares in Norwegian registered mutual funds was at the record level of NOK 472.7 billion. The figures also show that investments have decreased slightly and that investments have shifted towards bond funds and money market funds.
From the end of the fourth quarter of 2009 to the end of the first quarter of 2010, the total value of mutual fund shares increased by NOK 24 billion, or 5.3 per cent, to NOK 472.7 billion. The value of the Norwegian registered mutual funds is now 3.6 per cent higher than at the previously highest level in the fourth quarter of 2007.
The increase in the value of mutual funds from the previous quarter is due to net purchases of NOK 12 billion and rising values of the funds’ portfolios. This is also the fifth quarter in a row that net purchases of mutual fund shares were higher than net sales.
From equity funds to bond and money market funds
The total net purchases in equity funds decreased significantly in comparison to the three previous quarters and ended at NOK 3.8 billion. In comparison, net purchases of shares in equity funds amounted to NOK 18.9 billion in shares in the fourth quarter of 2010. Of the total net purchases in all types of funds of NOK 12 billion in the first quarter of 2010, a whole NOK 8 billion was placed in bond and money market funds. Investing in bond and money market funds is associated with lower risk than investing in equity funds.
Life insurance companies invest in bond funds
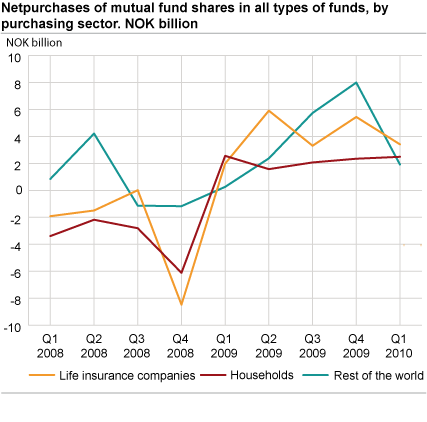
Companies in the life insurance sector invested a total of NOK 3.4 billion in mutual funds, of which NOK 2.4 billion was invested in bond funds. This is in contrast to the development in the previous two quarters where life insurance companies made most of their investments in equity funds. This change in investment strategy could indicate that the life insurance companies have wanted to reduce the risk that they are exposed to.
Households continue to invest
The statistics Securities registered with the Norwegian Central Securities Depository showed that the households´ appetite for investing in equity during the first quarter of 2010 was decreasing. Mutual fund statistics in the first quarter of 2010, however, show that households have continued to invest in mutual fund shares. This sector net purchased shares of NOK 2.5 billion in the first quarter of 2010. However, as is the case for life insurance companies, households have also shifted their investments towards bond funds. Of the total net purchases, NOK 1.1 billion was placed in bond funds and NOK 0.6 billion in equity funds.
Foreign investors continued to invest in mutual funds during the first quarter of this year. Net purchases by foreign investors ended at NOK 1.9 billion in the first quarter of 2010. Nearly all of this was placed in equity funds. Foreign investors’ total net purchases were, however, four times higher in the previous quarter.
Life insurance companies still the largest owner
At the end of the first quarter of 2010, life insurance companies were still the largest owner sector in mutual funds, with an owner share of 27.9 per cent. Households have, however, had their owner share increased significantly due to adjustments made in the statistics. This sector now has an owner share of 27.4 per cent. Foreign investors´ owner share increased to NOK 14.2 billion at the end of the first quarter of 2010.
| Q4 2008 | Q1 2009 | Q2 2009 | Q3 2009 | Q4 2009 | Q4 2010 | ||||||||||||||||||||||||||||||||||||||||||||||||||||||||||||||||||||||||||
|---|---|---|---|---|---|---|---|---|---|---|---|---|---|---|---|---|---|---|---|---|---|---|---|---|---|---|---|---|---|---|---|---|---|---|---|---|---|---|---|---|---|---|---|---|---|---|---|---|---|---|---|---|---|---|---|---|---|---|---|---|---|---|---|---|---|---|---|---|---|---|---|---|---|---|---|---|---|---|---|
| Total | |||||||||||||||||||||||||||||||||||||||||||||||||||||||||||||||||||||||||||||||
| Mutual funds shares capital | 317 641 | 313 151 | 366 313 | 407 386 | 448 739 | 472 695 | |||||||||||||||||||||||||||||||||||||||||||||||||||||||||||||||||||||||||
| Net purchases | -28 673 | 11 318 | 13 682 | 15 711 | 20 414 | 12 030 | |||||||||||||||||||||||||||||||||||||||||||||||||||||||||||||||||||||||||
| General government | |||||||||||||||||||||||||||||||||||||||||||||||||||||||||||||||||||||||||||||||
| Mutual funds Mutual funds shares capital capital | 12 997 | 13 200 | 14 192 | 14 883 | 14 776 | 15 042 | |||||||||||||||||||||||||||||||||||||||||||||||||||||||||||||||||||||||||
| Net purchases | -752 | 668 | 283 | 232 | -457 | -149 | |||||||||||||||||||||||||||||||||||||||||||||||||||||||||||||||||||||||||
| Financial corporations | |||||||||||||||||||||||||||||||||||||||||||||||||||||||||||||||||||||||||||||||
| Mutual funds shares capital | 148 335 | 148 129 | 170 074 | 185 298 | 200 007 | 206 706 | |||||||||||||||||||||||||||||||||||||||||||||||||||||||||||||||||||||||||
| Net purchases | -15 960 | 6 611 | 8 055 | 5 385 | 7 720 | 5 895 | |||||||||||||||||||||||||||||||||||||||||||||||||||||||||||||||||||||||||
| Non-financial corporations | |||||||||||||||||||||||||||||||||||||||||||||||||||||||||||||||||||||||||||||||
| Mutual funds shares capital | 39 358 | 38 126 | 42 350 | 46 513 | 50 666 | 53 990 | |||||||||||||||||||||||||||||||||||||||||||||||||||||||||||||||||||||||||
| Net purchases | -5 100 | 509 | -418 | 1 478 | 1 842 | 1 884 | |||||||||||||||||||||||||||||||||||||||||||||||||||||||||||||||||||||||||
| Households | |||||||||||||||||||||||||||||||||||||||||||||||||||||||||||||||||||||||||||||||
| Mutual funds shares capital | 85 668 | 84 844 | 101 221 | 112 277 | 122 332 | 129 676 | |||||||||||||||||||||||||||||||||||||||||||||||||||||||||||||||||||||||||
| Net purchases | -5 689 | 3 269 | 3 390 | 2 882 | 3 321 | 2 487 | |||||||||||||||||||||||||||||||||||||||||||||||||||||||||||||||||||||||||
| Rest of the world | |||||||||||||||||||||||||||||||||||||||||||||||||||||||||||||||||||||||||||||||
| Mutual funds shares capital | 31 283 | 28 852 | 38 476 | 48 415 | 60 958 | 67 281 | |||||||||||||||||||||||||||||||||||||||||||||||||||||||||||||||||||||||||
| Net purchases | -1 172 | 261 | 2 372 | 5 734 | 7 988 | 1 913 | |||||||||||||||||||||||||||||||||||||||||||||||||||||||||||||||||||||||||
Adjustments made in the mutual fund statistics due to nominee ownershipIn order to show the actual owners in mutual funds, adjustments have been made in the statistical material. This has caused a decrease in banks and financial auxiliaries’ owner share, while employees/households have had their owner share increased.
The adjustments, which include both owner positions and net purchases of mutual fund shares, have been made in all quarters dating back to the first quarter of 2008. In the statistics for the first quarter of 2010, owner positions of NOK 14 billion have been transferred to employees/households, of which NOK 6 billion was moved from banks and NOK 8 billion taken from financial auxiliaries.
Nominee-ownership is where parties other than the actual owners are registered in the investment companies’ registers. In this context, this means that banks and financial auxiliaries have been registered as owners on behalf of employees/households. |
Tables
The statistics is now published as Mutual funds.
Contact
-
Harald Stormoen
E-mail: harald.stormoen@ssb.no
tel.: (+47) 95 91 95 91
-
Steven Chun Wei Got
E-mail: steven.got@ssb.no
tel.: (+47) 90 82 68 27


