Content
Published:
This is an archived release.
Decline in net purchases of funds
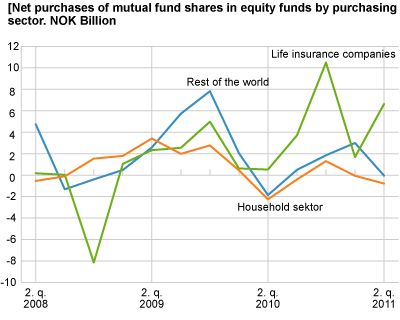
The total net purchases of mutual fund shares were a mere NOK 2.3 billion at the end of the second quarter of 2011; a considerable decline compared to the NOK 39 billion of the first quarter. Life insurance companies bought NOK 3.5 billion net worth of fund shares.
While the net purchases of equity funds were NOK 6.2 billion, NOK 4.7 billion net sales of money market funds were registered. In total, net purchases ended up as NOK 2.3 billion, which accounts for a considerable decline in comparison to the net purchase figure of NOK 39.0 billion in the previous quarter.
Life insurance companies invested most
As the largest owner sector in the mutual funds market, life insurance companies invested a total of NOK 3.5 billion in all types of funds. Life insurance companies placed NOK 6.6 billion in bond funds and their net sales of money market funds and bond funds were NOK 2.0 and NOK 1.1 billion respectively.
Total value of mutual fund shares were lower
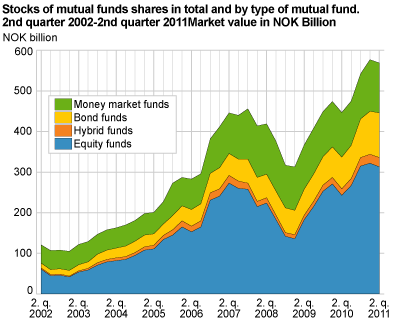
From the end of the first quarter of 2011 to the end of the second quarter of 2011, the total value of mutual funds decreased by 1.6 per cent to NOK 568.5 billion. This may be explained by the decrease in the value of the funds’ portfolios. The value of the money market funds declined by 3.4 per cent and the value of the equity bonds fell by 3.4 per cent.
Households net sold equity funds and money market funds
The household sector’s total net sales of mutual fund shares were about NOK 1.0 during the second quarter of 2011. Households net sold NOK 0.8 billion worth of equity funds and NOK 0.7 billion of money market funds, while they net purchased NOK 0.4 billion of hybrid funds.
Foreign investors diminished as well
Foreign investors net purchased NOK 0.6 billion worth of mutual funds in the second quarter of 2011. Most of these investments of about NOK 0.3 billion, went to purchase bond funds.
Small changes in the ownership
At the end of the second quarter of 2011, life insurance companies’ share of the mutual funds was 34.9 per cent. Households’ owner share was lower than the first quarter and was 23.1 per cent. Foreign investors’ owner share was 14.0 per cent; slightly lower than at the end of the first quarter of 2011.
| Q4 2009 | Q1 2010 | Q2 2010 | Q3 2010 | Q4 2010 | Q1 2011 | Q2 2011 | |||||||||||||||||||||||||||||||||||||||||||||||||||||||||||||||||||||||||
|---|---|---|---|---|---|---|---|---|---|---|---|---|---|---|---|---|---|---|---|---|---|---|---|---|---|---|---|---|---|---|---|---|---|---|---|---|---|---|---|---|---|---|---|---|---|---|---|---|---|---|---|---|---|---|---|---|---|---|---|---|---|---|---|---|---|---|---|---|---|---|---|---|---|---|---|---|---|---|---|
| Total | |||||||||||||||||||||||||||||||||||||||||||||||||||||||||||||||||||||||||||||||
| Mutual funds shares capital | 448 739 | 474 148 | 446 429 | 474 826 | 541 676 | 577 615 | 568 456 | ||||||||||||||||||||||||||||||||||||||||||||||||||||||||||||||||||||||||
| Net purchases | 20 414 | 12 272 | -7 155 | 3 893 | 34 715 | 39 014 | 2 303 | ||||||||||||||||||||||||||||||||||||||||||||||||||||||||||||||||||||||||
| General government | |||||||||||||||||||||||||||||||||||||||||||||||||||||||||||||||||||||||||||||||
| Mutual funds Mutual funds shares capital capital | 14 776 | 15 323 | 14 453 | 14 700 | 14 569 | 14 572 | 14 327 | ||||||||||||||||||||||||||||||||||||||||||||||||||||||||||||||||||||||||
| Net purchases | -457 | -129 | -624 | -153 | -605 | 237 | -191 | ||||||||||||||||||||||||||||||||||||||||||||||||||||||||||||||||||||||||
| Financial corporations | |||||||||||||||||||||||||||||||||||||||||||||||||||||||||||||||||||||||||||||||
| Mutual funds shares capital | 200 007 | 208 280 | 200 395 | 213 991 | 254 331 | 283 872 | 284 967 | ||||||||||||||||||||||||||||||||||||||||||||||||||||||||||||||||||||||||
| Net purchases | 7 720 | 6 146 | -530 | 3 811 | 27 485 | 31 672 | 4 851 | ||||||||||||||||||||||||||||||||||||||||||||||||||||||||||||||||||||||||
| Non-financial corporations | |||||||||||||||||||||||||||||||||||||||||||||||||||||||||||||||||||||||||||||||
| Mutual funds shares capital | 50 666 | 53 989 | 49 309 | 51 574 | 58 462 | 61 201 | 58 009 | ||||||||||||||||||||||||||||||||||||||||||||||||||||||||||||||||||||||||
| Net purchases | 1 842 | 1 883 | -2 756 | 183 | 4 394 | 2 358 | -1 943 | ||||||||||||||||||||||||||||||||||||||||||||||||||||||||||||||||||||||||
| Households | |||||||||||||||||||||||||||||||||||||||||||||||||||||||||||||||||||||||||||||||
| Mutual funds shares capital | 122 332 | 128 085 | 118 545 | 125 784 | 136 104 | 135 445 | 131 527 | ||||||||||||||||||||||||||||||||||||||||||||||||||||||||||||||||||||||||
| Net purchases | 3 321 | 2 313 | -2 199 | -167 | 1 162 | 1 320 | -974 | ||||||||||||||||||||||||||||||||||||||||||||||||||||||||||||||||||||||||
| Rest of the world | |||||||||||||||||||||||||||||||||||||||||||||||||||||||||||||||||||||||||||||||
| Mutual funds shares capital | 60 958 | 68 471 | 63 727 | 68 777 | 78 210 | 82 525 | 79 626 | ||||||||||||||||||||||||||||||||||||||||||||||||||||||||||||||||||||||||
| Net purchases | 7 988 | 2 058 | -1 046 | 219 | 2 286 | 3 427 | 560 | ||||||||||||||||||||||||||||||||||||||||||||||||||||||||||||||||||||||||
The statistics is now published as Mutual funds.
Contact
-
Harald Stormoen
E-mail: harald.stormoen@ssb.no
tel.: (+47) 95 91 95 91
-
Steven Chun Wei Got
E-mail: steven.got@ssb.no
tel.: (+47) 90 82 68 27


