Content
Published:
This is an archived release.
Major decline in equity funds’ capital
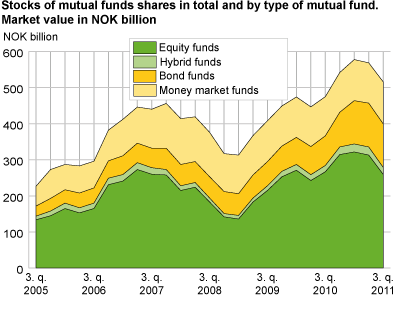
The total value of the mutual fund shares was reduced by NOK 52.6 billion at the end of the 3rd quarter of 2011. This is the largest loss of value in the shares during a quarter since the 4th quarter of 2008. Investors net sold NOK 3.1 billion worth of fund shares in the 3rd quarter.
|
Tables in StatBank are not updated with the latest figures. |
From the end of the 2nd quarter to the end of the 3rd quarter of 2011, the total value of mutual funds’ capital decreased by 9.3 per cent to NOK 515.8 billion. The value of the equity funds’ shares declined by as much as 17.1 per cent. This is a consequence of the turmoil in the international financial markets and in the Norwegian stock exchange during recent months. More detailed information on the subject can be found on our website regarding Securities registered with the Norwegian Central Securities Depository.
The market value of the hybrid funds fell by 13.8 per cent, while the money market funds gained value by 4.2 per cent. The market value of the bond funds went slightly down by less than 1 per cent.
Investors sold bond funds and equity funds
There was a net sale of bond funds worth NOK 3.3 billion in the 3rd quarter, while a NOK 4.0 billion net purchase of money market funds was registered. In total, net sales of mutual funds ended at NOK 3.1 billion.
Foreign investors net sold most
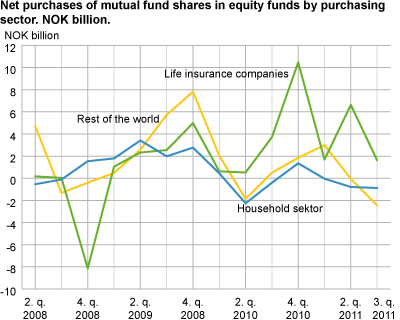
Foreign investors net sold NOK 2.0 billion worth of mutual funds in the 3rd quarter of 2011. Most of the sales were in equity funds worth NOK 2.5 billion. However, they invested a total of NOK 0.5 billion in money market funds and bond funds.
Life insurance companies invested in money market funds and equity funds
The largest owners in the mutual funds market; life insurance companies, placed NOK 1.6 billion and NOK 1.0 billion in equity funds and money market funds respectively. Companies in this sector on the other hand sold bond fund shares worth NOK 2.0 billion. Therefore, their investment amounted to NOK 0.6 billion in total.
Households were hesitant in selling mutual funds’ shares
The household sector’s total net sales of mutual funds ended at NOK 1.5 billion during the 3rd quarter of 2011. Households net sold NOK 0.9 billion worth of equity funds, NOK 0.3 billion of hybrid funds and NOK 0.2 billion in money market funds. Net sales were not very high when taking into account the huge decline of a NOK 17.8 billion loss in value in the mutual funds’ capital during the 3rd quarter.
Ownership of life insurance companies increased
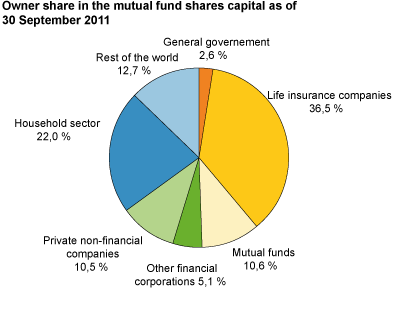
At the end of the 3rd quarter of 2011, life insurance companies’ share of the mutual funds increased to 36.5 per cent of the total compared to 34.9 per cent of the previous quarter. Households’ owner share was 23.1 per cent, which was lower than the 2nd quarter. Foreign investors’ owner share also decreased, from 14.0 to 12.7 per cent.
| Q1 2010 | Q2 2010 | Q3 2010 | Q4 2010 | Q1 2011 | Q2 2011 | Q3 2011 | |||||||||||||||||||||||||||||||||||||||||||||||||||||||||||||||||||||||||
|---|---|---|---|---|---|---|---|---|---|---|---|---|---|---|---|---|---|---|---|---|---|---|---|---|---|---|---|---|---|---|---|---|---|---|---|---|---|---|---|---|---|---|---|---|---|---|---|---|---|---|---|---|---|---|---|---|---|---|---|---|---|---|---|---|---|---|---|---|---|---|---|---|---|---|---|---|---|---|---|
| Total | |||||||||||||||||||||||||||||||||||||||||||||||||||||||||||||||||||||||||||||||
| Mutual funds shares capital | 474 148 | 446 429 | 474 826 | 541 667 | 577 607 | 568 445 | 515 808 | ||||||||||||||||||||||||||||||||||||||||||||||||||||||||||||||||||||||||
| Net purchases | 12 272 | -7 155 | 3 893 | 34 722 | 39 201 | 2 415 | -3 102 | ||||||||||||||||||||||||||||||||||||||||||||||||||||||||||||||||||||||||
| General government | |||||||||||||||||||||||||||||||||||||||||||||||||||||||||||||||||||||||||||||||
| Mutual funds shares capital | 15 323 | 14 453 | 14 700 | 14 569 | 14 572 | 14 327 | 13 424 | ||||||||||||||||||||||||||||||||||||||||||||||||||||||||||||||||||||||||
| Net purchases | -129 | -624 | -153 | -605 | 237 | -191 | -452 | ||||||||||||||||||||||||||||||||||||||||||||||||||||||||||||||||||||||||
| Financial corporations | |||||||||||||||||||||||||||||||||||||||||||||||||||||||||||||||||||||||||||||||
| Mutual funds shares capital | 208 280 | 200 395 | 213 991 | 254 188 | 283 687 | 285 006 | 269 110 | ||||||||||||||||||||||||||||||||||||||||||||||||||||||||||||||||||||||||
| Net purchases | 6 146 | -530 | 3 811 | 27 494 | 31 823 | 4 962 | 565 | ||||||||||||||||||||||||||||||||||||||||||||||||||||||||||||||||||||||||
| Non-financial corporations | |||||||||||||||||||||||||||||||||||||||||||||||||||||||||||||||||||||||||||||||
| Mutual funds shares capital | 53 989 | 49 309 | 51 574 | 58 475 | 61 215 | 58 008 | 53 957 | ||||||||||||||||||||||||||||||||||||||||||||||||||||||||||||||||||||||||
| Net purchases | 1 883 | -2 756 | 183 | 4 385 | 2 358 | -1 943 | 286 | ||||||||||||||||||||||||||||||||||||||||||||||||||||||||||||||||||||||||
| Households | |||||||||||||||||||||||||||||||||||||||||||||||||||||||||||||||||||||||||||||||
| Mutual funds shares capital | 128 085 | 118 545 | 125 784 | 136 143 | 135 109 | 131 479 | 113 720 | ||||||||||||||||||||||||||||||||||||||||||||||||||||||||||||||||||||||||
| Net purchases | 2 313 | -2 199 | -167 | 1 162 | 1 327 | -973 | -1 510 | ||||||||||||||||||||||||||||||||||||||||||||||||||||||||||||||||||||||||
| Rest of the world | |||||||||||||||||||||||||||||||||||||||||||||||||||||||||||||||||||||||||||||||
| Mutual funds shares capital | 68 471 | 63 727 | 68 777 | 78 292 | 83 024 | 79 625 | 65 597 | ||||||||||||||||||||||||||||||||||||||||||||||||||||||||||||||||||||||||
| Net purchases | 2 058 | -1 046 | 219 | 2 286 | 3 456 | 560 | -1 991 | ||||||||||||||||||||||||||||||||||||||||||||||||||||||||||||||||||||||||
The statistics is now published as Mutual funds.
Contact
-
Harald Stormoen
E-mail: harald.stormoen@ssb.no
tel.: (+47) 95 91 95 91
-
Steven Chun Wei Got
E-mail: steven.got@ssb.no
tel.: (+47) 90 82 68 27


