Content
Published:
This is an archived release.
Further increase in surplus of males in 2015
At the turn of the year, the population of 5 214 000 was made up of 36 200 more males than females. The population increased by 48 200 during 2015. The change from a surplus of females to a surplus of males was registered for the first time on 1 January 2011.
| 2016 | Change in percent | |||
|---|---|---|---|---|
| 2015 - 2016 | 2011 - 2016 | 2006 - 2016 | ||
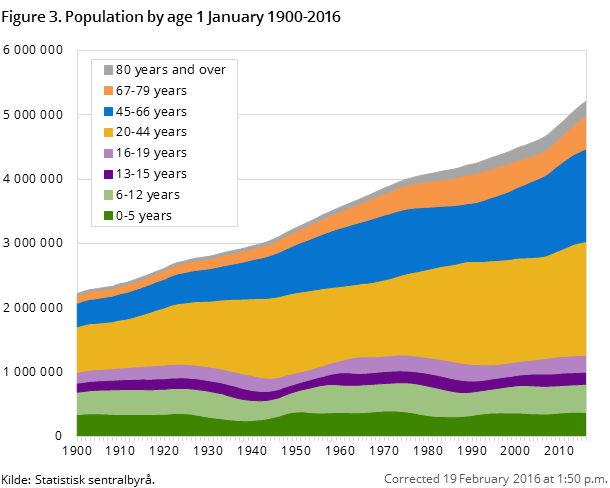
| Total | 5 213 985 | 0.9 | 6.0 | 12.4 |
| 0 years | 59 396 | 0.0 | -3.7 | 4.3 |
| 1-5 years | 310 725 | -1.2 | 1.2 | 6.8 |
| 6-12 years | 441 838 | 1.9 | 4.1 | 2.2 |
| 13-15 years | 186 284 | -1.4 | -3.4 | -2.1 |
| 16-19 years | 262 536 | 0.0 | 1.2 | 11.5 |
| 20-44 years | 1 769 024 | 0.5 | 5.4 | 11.2 |
| 45-66 years | 1 439 486 | 1.0 | 5.9 | 16.3 |
| 67-79 years | 524 671 | 4.5 | 26.2 | 34.4 |
| 80 years and over | 220 025 | -0.2 | -0.5 | 1.9 |
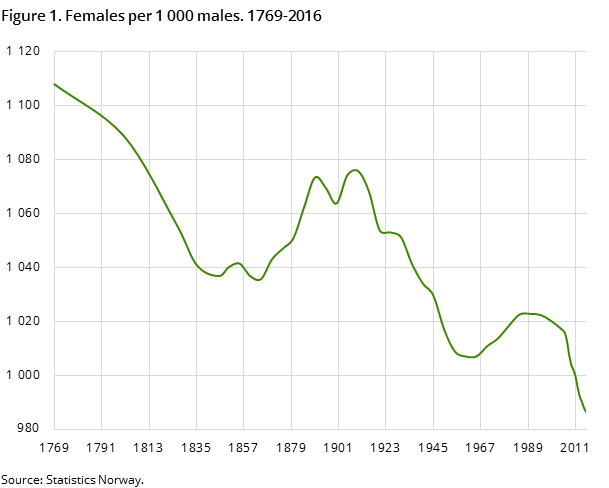
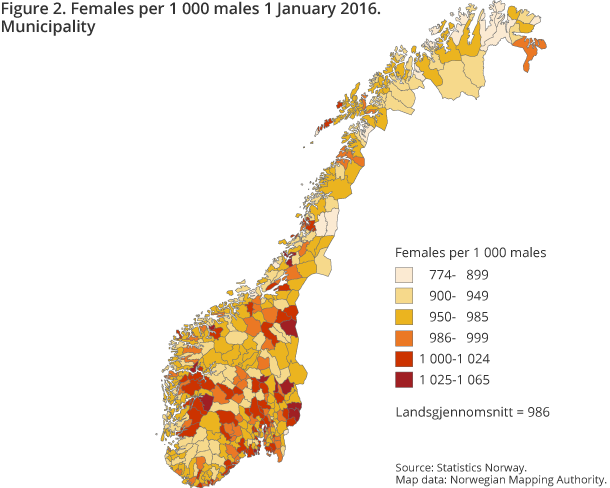
The change from a surplus of females to a surplus of males is a result of several demographic factors. Labour immigration from abroad is one of the main reasons behind the growing surplus of males and the greater fall in the mortality rate for men than for women. Historically, the surplus of females has varied considerably, between approximately 1 100 females per 1 000 males in 1769 and 1 007 in 1960, but women have always been in the majority. After the mid-1960s, the ratio increased to 1 022 around 1990, and then decreased again. Measured in persons, the surplus of females was greatest in 1910, at over 87 000, and was 12 000 in 1960.
Over ten per cent are foreign citizens
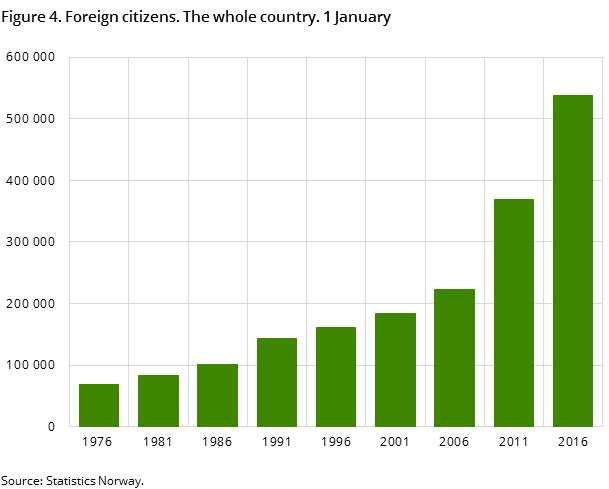
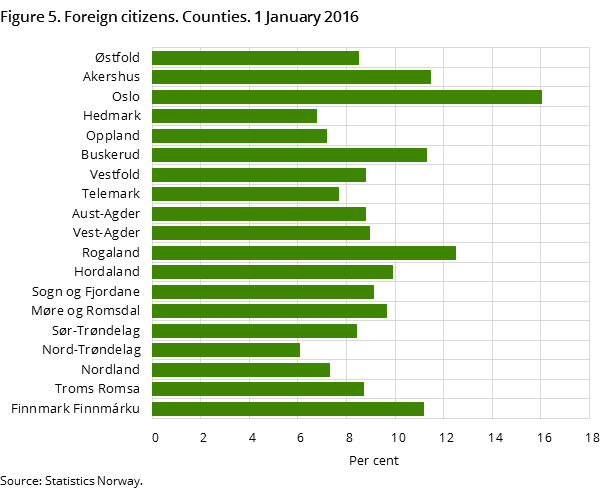
About 538 000 of the resident population were foreign citizens at the turn of the year, representing 10 per cent of the total population. Among foreign citizens, there was a surplus of males of 49 200. In the years from 1977, when figures were first available, to 1996, there was a surplus of males among foreign citizens. In the years 1997-2006 there was a surplus of females, but since 2007, when labour immigration began to increase, the surplus of males has grown, with a surplus at the turn of the year of 49 200 more males than females.
- Is it male or female surplus in your community ? See 07459: Population, by sex and one-year age groups. 1 January (M) in the StatBank.
Nearly 100 000 Polish citizens in Norway
Polish citizens still constitute the largest group of foreign citizens, with 99 600 residents. The other large groups are Swedish and Lithuanian citizens, with 45 100 and 41700 persons each.
While Polish males represented 65 per cent, or nearly 65 000 of the roughly 100 000 Polish citizens, Swedish females represented 48 per cent of Swedish citizens, with 21 500.
Changes in the number of foreign citizens in the population are largely due to in-migration and out-migration, as well as naturalisation.
Population growth in all counties
The population increased by 48 200 in 2015, which is 8 600 less than 2014. All counties saw a population increase, and the growth was largest in Oslo and Akershus, with an increase of 20 300. In Akershus, the growth was higher than in 2014, and in Oslo the growth was lower than in 2014.
The total population growth in Rogaland and Hordaland was 9 000, which is 3 800 lower than the year before. Rogaland saw a considerable change in 2015, when the growth was 2 800 lower than in 2014. The counties of Rogaland and Oslo had particularly lower growth than in 2014.
Contact
-
Magnus Haug
E-mail: magnus.haug@ssb.no
tel.: (+47) 40 81 14 91
-
Karstein Sørlien
E-mail: karstein.sorlien@ssb.no
tel.: (+47) 47 70 16 35
-
Linn Krokedal
E-mail: linn.krokedal@ssb.no
tel.: (+47) 95 47 97 47
-
Anders Sønstebø
E-mail: anders.sonstebo@ssb.no
tel.: (+47) 46 66 37 74
-
Espen Andersen
E-mail: espen.andersen@ssb.no
tel.: (+47) 92 61 00 46
-
Statistics Norway's Information Centre
E-mail: informasjon@ssb.no
tel.: (+47) 21 09 46 42
-
Oppdrag befolkningsstatistikk
E-mail: befolkning@ssb.no
