Content
Published:
This is an archived release.
Oslo has greatest growth
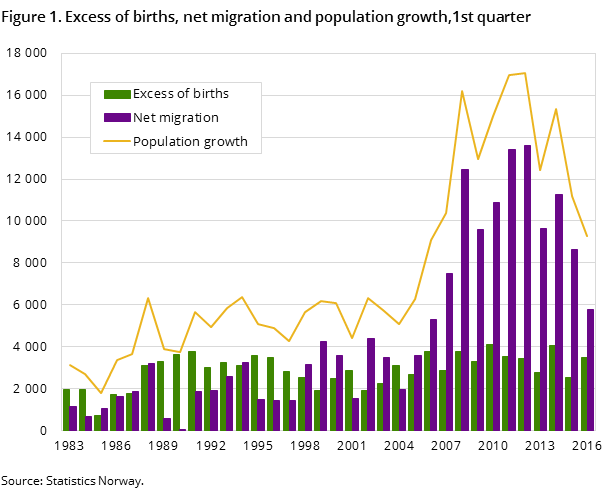
On 1 April, the population in Norway was 5 223 300. The population grew with 9 300 persons or 0.2 per cent in the 1st quarter. This growth was about 2 000 lower than the corresponding quarter last year. Oslo has still the greatest growth.
| 1st quarter 2016 | 1st quarter 2015 | Changes from same period previous year | |
|---|---|---|---|
| Population at the beginning of the quarter | 5 213 985 | 5 165 802 | 48 183 |
| Births | 14 533 | 14 074 | 459 |
| Deaths | 11 022 | 11 526 | -504 |
| Excess of births | 3 511 | 2 548 | 963 |
| Immigration | 14 496 | 16 926 | -2 430 |
| Emigration | 8 736 | 8 278 | 458 |
| Net migration, immigration and emigration incl | 5 760 | 8 648 | -2 888 |
| Population growth | 9 271 | 11 196 | -1 925 |
| Population at the end of the quarter | 5 223 256 | 5 176 998 | 46 258 |


Almost 14 500 immigrations were registered, while about 8 700 persons emigrated. Emigration was lower than in the last two quarters of 2015, when about 11 000 and 10 000 emigrated respectively. The birth surplus was about 1 000 higher than in the corresponding quarter last year. A total of 14 500 children were born, while 11 000 persons died.
Oslo continues to have greatest growth
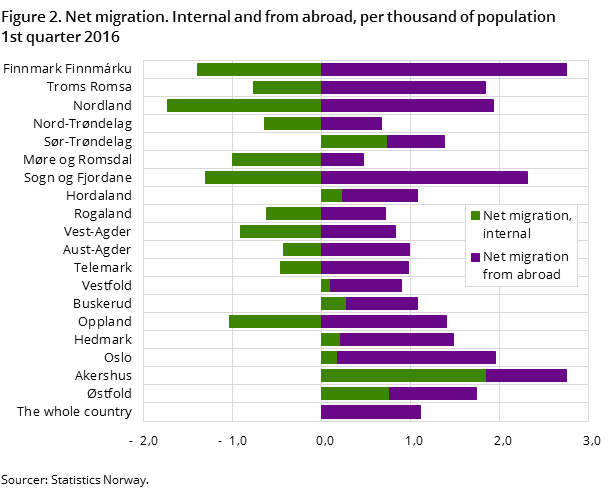
Once again, Oslo had the highest population growth and the highest birth surplus in the country. The population in Oslo increased by 0.39 per cent in the 1st quarter, while Akershus was second with an increase of 0.37 per cent. These were followed by Sør-Trøndelag and Østfold. Møre og Romsdal was the only county with a decreasing population. The highest birth deficit is found in Hedmark, where 200 more persons died than were born, while Vest-Agder and Rogaland had the second and third highest birth surplus respectively in relative figures.
Net migration to nearly all counties
All counties, except Vest-Agder and Møre og Romsdal had net migration in the 1st quarter. Akershus had the highest in-migration in total, while Oslo had the highest immigration from abroad and the highest internal in- and out-migration.
Poles continued to make up the largest immigration group
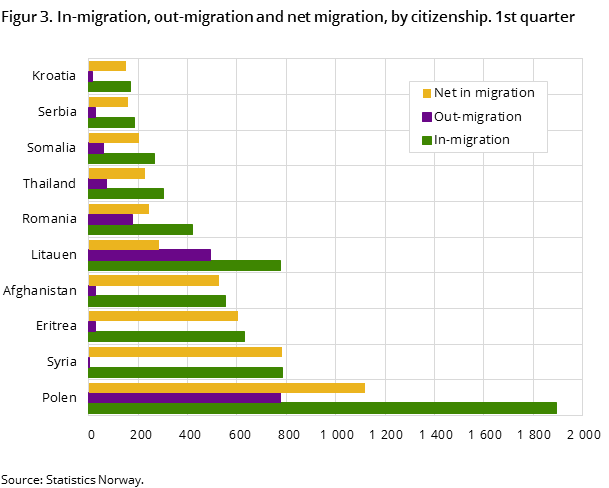
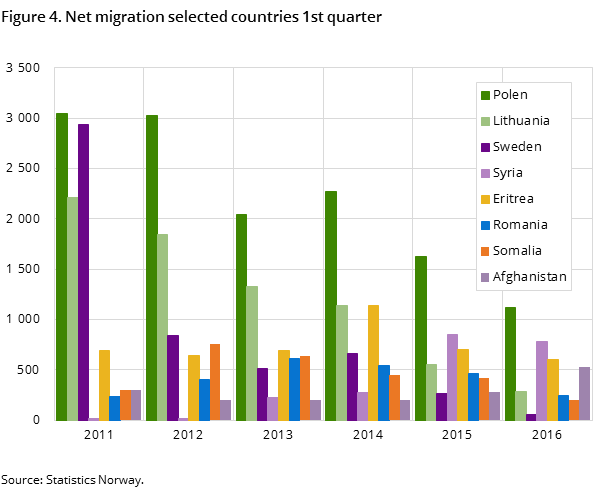
Over the last five years, net labour migration has fallen and net migration of refugees has increased. In the two last years alone, the net migration of Poles has been halved, and the net migration of Lithuanians has fallen by 75 per cent. Immigration from European countries continues, but many of these people also emigrate from Norway. This mostly applies to citizens from Poland, Lithuania, Spain, Latvia, Great Britain and Sweden. Persons from Syria, Eritrea, Afghanistan and Somalia made up four of the ten largest groups of registered immigrants in the 1st quarter. The registered net immigration is still low in relation to the net immigration over the last ten years. Many asylum seekers have not yet had their asylum applications considered or been granted a residence permit, and are therefore still not registered as residents in the Population Register or included in the figures on immigrants.
More information and statistics on immigration is available on The Norwegian Directorate of Immigration (UDI)
Clearing-up in the Central Population RegisterOpen and readClose
The Tax Administration continuously updates the Central Population Register to reflect the status of persons who no longer live in Norway. These updates have been standard practice in recent years.
Asylum seekersOpen and readClose
Only persons who have moved during the last 6 months are included in the statistics. Asylum seekers are not included, but these figures can be found on the UDI’s website.
Contact
-
Magnus Haug
E-mail: magnus.haug@ssb.no
tel.: (+47) 40 81 14 91
-
Karstein Sørlien
E-mail: karstein.sorlien@ssb.no
tel.: (+47) 47 70 16 35
-
Linn Krokedal
E-mail: linn.krokedal@ssb.no
tel.: (+47) 95 47 97 47
-
Anders Sønstebø
E-mail: anders.sonstebo@ssb.no
tel.: (+47) 46 66 37 74
-
Espen Andersen
E-mail: espen.andersen@ssb.no
tel.: (+47) 92 61 00 46
-
Statistics Norway's Information Centre
E-mail: informasjon@ssb.no
tel.: (+47) 21 09 46 42
-
Oppdrag befolkningsstatistikk
E-mail: befolkning@ssb.no
