Content
Published:
This is an archived release.
2008: Record high net immigration
In 2008, 67 000 immigrations and 24 000 emigrations were registered. Net immigration was 43 000; an increase of 3 700 compared to 2007. As in the previous years, Polish citizens made up the largest group of immigrants.
Of those having citizenship other than Norwegian, 37 700 or 64 per cent were citizens of EU membership countries. Similar percentages could also be seen in the 1960s, but the share decreased and as late as in 2003 the share was 37 per cent. Major immigration in previous years has been due to extraordinary situations resulting in large numbers of refugees, partly from the Balkans, partly from Iraq and other countries in Asia and Africa. At the moment, however, labour immigration from Poland, Germany, Lithuania and Sweden account for the increase in net immigration.
Europeans dominate
Polish citizens made up the largest group of immigrants (14 400) in 2008, followed by Swedish (5 700) and German citizens (4 300). This is the same order as in previous years. On the whole, immigration from single countries has been relatively stable in recent years, but for some countries there have been changes. A total of 1 300 more Swedish citizens came to Norway in 2008 than in 2007. From each of Lithuania, Romania and Germany, 500 more citizens arrived than the year before, and from Eritrea and The Palestinian Territory 400 more. Three hundred more Polish citizens came in 2008 than in 2007. On the other hand, 400 fewer Somalian citizens came, as well as 300 fewer Russian.
As for emigration, Swedish citizens made up the largest group with 2 700, followed by Polish citizens with 2 500. The increase was particularly large for Polish citizens, as twice as many emigrated in 2008 (2 500) than in 2007 (1 250).
Thus Polish citizens had the highest net immigration with 11 900, followed by German and Swedish citizens with 3 500 and 3 000 respectively. Since 2003, net immigration from Poland has increased from 300 to 11 900. Net immigration has almost doubled every year in recent years, but in 2008 there was a decrease of 1 000.
A total of 8 150 Norwegian citizens immigrated and 8 450 emigrated, resulting in a net emigration of 300, which is 200 fewer than in 2007.
Labour immigration dominates among the largest
From thirteen countries, immigration was at 1 000 or more in 2008. Among these countries were eight EU countries. Romania is a new addition to the list.
Where do they settle?
Oslo had the highest number of net immigration with 10 000, followed by Rogaland, Hordaland and Akershus with between 5 000 and 4 000 each. The net immigration to Oslo was five times the average for the period 2001-2005.
More than half of the net immigration by citizens from the new EU membership countries - 9 000 out of 16 800 - took place in Oslo/Akershus and Rogaland/Hordaland. Swedish and Danish citizens settled in Oslo - 1 400 of a total net immigration of 3 300.
Only five out of the 431 municipalities saw no net immigration from abroad.
|
Total per 1 000 of the population
(43 346 in all) (Norway = 9.09) |
Poland, Lithuania, Estonia, Latvia, Romania and Slovakia
per 1 000 of the population (16 794 in all) (Norway = 3.52) |
Germany, France, Netherlands, United Kingdom and USA
per 1 000 of the population (5 621 in all) (Norway = 1.18) |
|||||||||||||||||||||||||||||||||||||
|---|---|---|---|---|---|---|---|---|---|---|---|---|---|---|---|---|---|---|---|---|---|---|---|---|---|---|---|---|---|---|---|---|---|---|---|---|---|---|---|
| 1 | Oslo | 17.65 | Oslo | 5.38 | Oslo | 2.25 | |||||||||||||||||||||||||||||||||
| 2 | Rogaland | 11.70 | Rogaland | 5.14 | Rogaland | 1.93 | |||||||||||||||||||||||||||||||||
| 3 | Finnmark Finnmárku | 10.41 | Møre og Romsdal | 4.37 | Sogn og Fjordane | 1.85 | |||||||||||||||||||||||||||||||||
|
Denmark and Sweden per 1 000 of the population
(3 265 in all) (Norway = 0.68) |
Ethiopia, Eritrea, Somalia, Afghanistan, Burma, Iraq and Iran
per 1 000 of the population (4 820 in all) (Norway = 1.01) |
Women from Filippines, Thailand, Brazil, Colombia and Russia
per 1 000 of the population (3 008 in all) (Norway = 0.63) |
|||||||||||||||||||||||||||||||||||||
| 1 | Oslo | 2.39 | Nordland | 1.73 | Finnmark Finnmárku | 1.38 | |||||||||||||||||||||||||||||||||
| 2 | Rogaland | 0.68 | Troms Romsa | 1.62 | Oslo | 1.03 | |||||||||||||||||||||||||||||||||
| 3 | Akershus | 0.62 | Vest-Agder | 1.45 | Rogaland | 0.78 | |||||||||||||||||||||||||||||||||
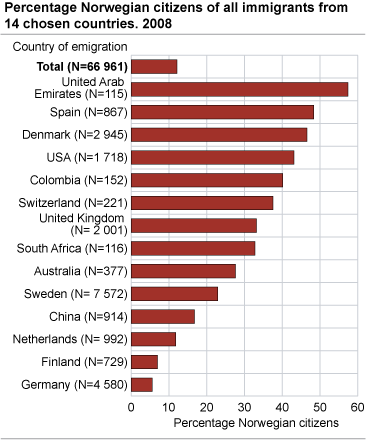
Large share of Norwegian citizens
In total, 8 150 or 12 per cent of all immigrants were Norwegian citizens in 2008. Norwegian citizens account for a considerable share of the immigration from some countries. They may be students or professionals, or they live abroad for large parts of the year.
Tables:
- Table 1 Immigration and emigration. 1951-2008
- Table 2 Immigration/emigration, by county. 1966-2008
- Table 3 Immigration, by country. 1966-2008
- Table 4 Emigration, by country. 1966-2008
- Table 5 Net in-migration, by country. 1966-2008
- Table 6 Immigration and emigration, by sex, age and marital status of migrants. 2008
- Table 7 Immigration and emigration, by sex and age of migrants. 2008
- Table 8 Immigration, emigration and net immigration, by sex, age of migrants and county. 2008
- Table 9 Immigration and emigration, by citizenship, 2008
- Table 10 Immigration and emigration, by Norwegian/foreign citizenship and country of immigration/emigration. 2008
- Table 11 Immigration, by citizenship and region. 2008
- Table 12 Emigration, by citizenship and region. 2008
The statistics is published with Migrations.


