Content
Published:
This is an archived release.
Most activity in West Norway
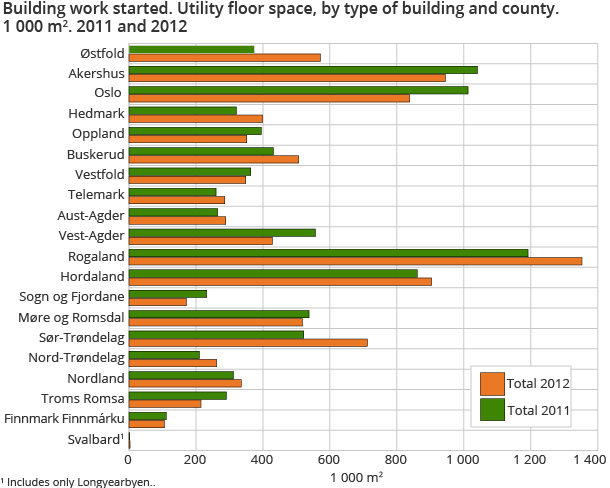
In 2012, building was started on 30 189 dwellings with 4 million square metres of utility floor space. New dwellings increased by 8.8 per cent compared with 2011. Rogaland county in the South West of Norway had the highest building activity.
| Dwellings | 1 000 m2 | ||
|---|---|---|---|
| Number | Utility floor space in dwellings | Utility floor space other than in dwellings | |
| 2000 | 23 550 | 3 315 | 3 941 |
| 2001 | 25 266 | 3 409 | 3 922 |
| 2002 | 22 980 | 3 044 | 3 755 |
| 2003 | 23 177 | 2 957 | 3 780 |
| 2004 | 29 999 | 3 543 | 4 239 |
| 2005 | 31 608 | 3 849 | 4 602 |
| 2006 | 33 314 | 4 081 | 4 969 |
| 2007 | 32 520 | 4 025 | 6 024 |
| 2008 | 25 950 | 3 379 | 6 205 |
| 2009 | 19 748 | 2 749 | 5 043 |
| 2010 | 21 145 | 3 059 | 5 727 |
| 2011 | 27 735 | 3 805 | 5 491 |
| 2012 | 30 189 | 4 039 | 5 505 |
Rogaland is the county with the highest building activity, with 4 348 new dwellings and 639 000 square metres of utility floor space for dwellings. Building on every seventh dwelling has been started in Rogaland, however Oslo has the highest figure for flats, with 2 823 new dwellings.
Measured in utility floor space for dwellings; Oslo, Trondheim and Bergen are the top three. Among the 20 municipalities with most new utility floor space for dwellings, seven are situated in Rogaland.
Twenty-four municipalities had no new dwellings registered, and 10 of these had no building activity registered at all. Seven out of 10 municipalities without building activity are situated in the northern part of Norway.
Over 5 million square metres for business and leisure
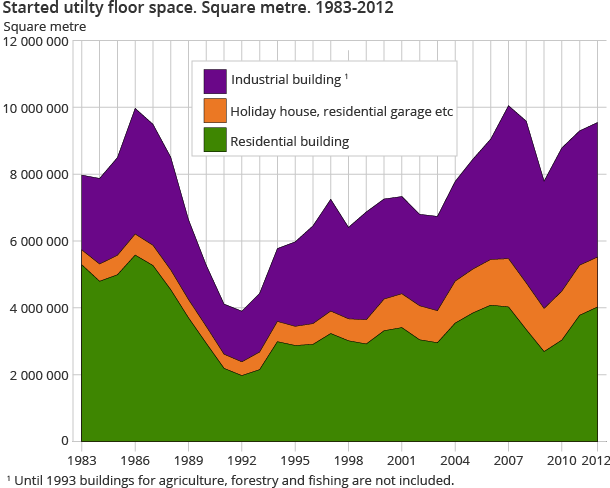
In 2012, building was started on 5.5 million square metres of utility floor space for other than dwellings, about the same level as the year before. Of this, nearly 1.5 million square metres was within holiday houses. Four million square metres were started up within the business sector, where industrial and office buildings account for more than half of the activity.
Registered building permissionsOpen and readClose
Figures for buildings in the building statistics rely on dates for when permits are registered by the municipality in the data register (Matrikkelen). A building permit does not always mean that construction will be started at once. Especially in low conjunctures it might be that construction projects are not realised, or may be postponed after a building permit has been granted. When the building activity trend turns from a low to a high level, and vice versa, this could affect the interpretation of the statistics.
More details about comparability, quality and other information are available in About the statistics .
Contact
-
Jens Mathiesen
E-mail: jens.mathiesen@ssb.no
tel.: (+47) 40 81 13 98
-
Magnus Espeland
E-mail: magnus.espeland@ssb.no
tel.: (+47) 45 27 40 08


