Content
Published:
This is an archived release.
Large new building projects
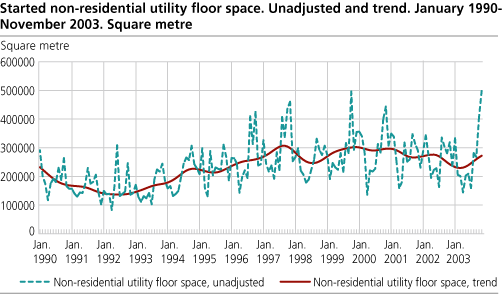
From January to November last year 400 000 square meters utility floor space were started for other than dwelling purposes in Oslo. Of this, the Norwegian school of management BI and the new opera building constitute one-third by 140 000 square meters.
In the entire country 3.34 million square meters were started for other than dwelling purposes during the first 11 months of 2003. Of this, 2.5 million square meters were utility floor space for different industries - an increase of 1.2 per cent compared with the same period in 2002. The remaining 0.84 million square meters were holiday properties and private garages. This category decreased by almost 9 per cent compared with the eleven first months of 2002.
Less new dwellings in November
In November last year 1 944 new dwellings were started - a decrease of almost 15 per cent compared with November 2002. 20 589 dwellings were started from January to November 2003, a decrease of 1 per cent compared with the same period in 2002.
When comparing the number of new dwellings the first eleven months of last year with the corresponding period in 2002, Nordland recorded the largest increase of all counties by 52 per cent. Finnmark and Oslo increased 38 and 28 per cent respectively. The decrease was largest in Hedmark where the number of new dwellings fell by 28 per cent compared with January to November 2002.
The recording of non-residential buildings in the municipality of Oslo was imperfect for the years 2001, 2002 and the beginning of 2003, subsequently the figures for Oslo so far this year are lower than the actual situation.
Tables:
- Table 1 Building work started. Preliminary figures,
- Table 2 Building activity in November. Preliminary figures,
- Table 3 Building work started in January-November, by county. Preliminary figures,
- Table 4 Buildings under conctruction per 30 November, by county. Preliminary figures
- Table 5 Buildings completed in January-November, by county. Preliminary figures,
- Table 6 Building work started. Not adjusted, seasonally adjusted and trend. Preliminary figures
- Table 7 Building work started in November, by county. Preliminary figures
- Table 8 Buildings permits in November. Preliminary figures,. Breakdown according to Eurostat classifications
- Table 9 Average monthly registration delay for buildings started. January 2000-November 2003
Contact
-
Jens Mathiesen
E-mail: jens.mathiesen@ssb.no
tel.: (+47) 40 81 13 98
-
Magnus Espeland
E-mail: magnus.espeland@ssb.no
tel.: (+47) 45 27 40 08


