Content
Published:
This is an archived release.
Stability in building of dwellings
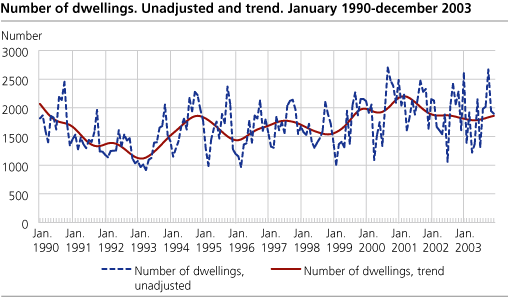
22 487 dwellings were recorded started in 2003 shows preliminary figures - about the same number as the previous year.
In the entire country 53 more dwellings were started in 2003 than in 2002, an increase of 0.2 per cent. The counties of Hedmark and Telemark recorded a decrease in the number of dwellings by 28.9 and 25.5 per cent respectively. The largest increase was recorded in the northernmost counties - 87.5 per cent in Finnmark and 51.7 per cent in Nordland.
A total of 2 882 200 square meters of utility floor space for dwellings were started in 2003. This is a decrease by 4 per cent compared to 2002.
Moderate decrease for other buildings
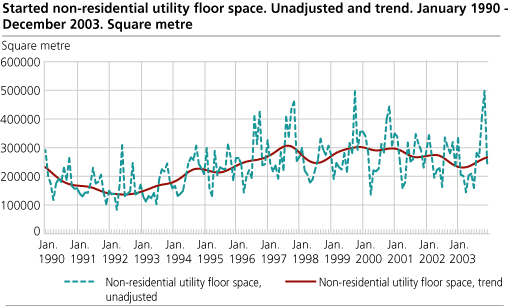
3 626 400 square meters of utility floor space were started for other buildings than dwellings in 2003. Of this, one forth was holiday properties and private garages - a decrease of 8.8 per cent compared with the previous year.
Other non-residential buildings are industrial buildings. For this category there has been an increase in started utility floor space of 2.4 per cent. The majority of started utility floor space was for agricultural purposes or manufacturing. These industries had 17 per cent each of started utility floor space in 2003. The largest increase in 2003 compared with 2002 was for buildings for transport and communication. For this category started utility floor space was 123 300 square meter, against 69 200 in 2002.
The recording of non-residential buildings in the municipality of Oslo was imperfect for the years 2001, 2002 and the beginning of 2003, subsequently the figures for Oslo so far this year are lower than the actual situation.
Tables:
- Table 1 Building work started. Preliminary figures,
- Table 2 Building activity in December. Preliminary figures,
- Table 3 Building work started in January-December, by county. Preliminary figures,
- Table 4 Buildings under conctruction per 31 December, by county. Preliminary figures
- Table 5 Buildings completed in January-December, by county. Preliminary figures,
- Table 6 Building work started. Not adjusted, seasonally adjusted and trend
- Table 7 Building work started in December, by county. Preliminary figures
- Table 8 Buildings permits in December. Preliminary figures,. Breakdown according to Eurostat classifications
- Table 9 Average monthly registration delay for buildings started. January 2000-December 2003
Contact
-
Jens Mathiesen
E-mail: jens.mathiesen@ssb.no
tel.: (+47) 40 81 13 98
-
Magnus Espeland
E-mail: magnus.espeland@ssb.no
tel.: (+47) 45 27 40 08


