Content
Published:
This is an archived release.
Most new flats in multi-dwelling buildings
During the first six months of 2006 a total of 8 526 dwellings were started in multi-dwelling buildings, an increase by 44.4 per cent compared to the first half of 2005. A total of 16 119 dwellings where started during the first half of 2006, up 8.1 per cent compared to the same period of 2005.
More than half of the new dwellings started during the first six months this year were in a multi-dwelling building. Most of them, 2 877 dwellings, were started in Oslo. This make up 87.2 per cent of the total number of new dwellings in the capital. In Akershus, Buskerud, Sør-Trøndelag and Troms multi-dwelling buildings also contributed to more than half of the started dwellings.
The statistics show a decrease in dwelling starts for all other building types when comparing the first six months of 2006 to the corresponding period in 2005.
Started utility floor space increased by 4.5 per cent from 1 821 000 square metres during the first half of 2005 to 1 903 000 during the same period of 2006.
More new holiday houses and industrial buildings
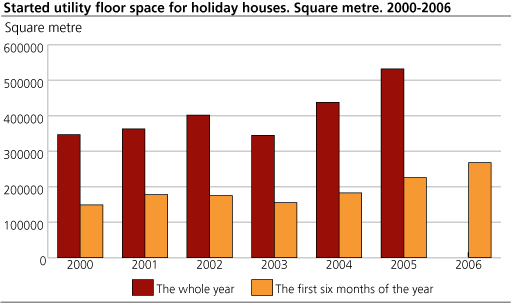
Building start of holiday houses increased from 226 000 square metres of utility space during the first six months of 2005 to 268 000 square in 2006, a 18.6 per cent increase.
During the first half of 2006 a total of 1 715 000 square metres of utility floor space for industrial purposes were started, an increase by 16.4 percent compared to the same period last year. Except buildings for fishing and agriculture, all categories of industrial buildings had an increase in utility floor space started. Most new square metres was recorded for office and business buildings, with 527 000 square metres of utility space during the first six months of the year. Compared to the same period of 2005 the increase of started utility space in this category of buildings in Oslo was 266.7 per cent.
Deviation from the monthly building statistics
The figures that are presented in the monthly building statistics are preliminary, and the sum of the three months in a quarter can deviate from the quarterly building statistics. This is because there may be corrections in the Ground Property, Address and Building Register (GAB).
Tables:
- Table 1 Buildings work started. Dwellings and utility floor space in dwellings, by type of building and quarter
- Table 2 Buildings work started. Utility floor space, by type of building and quarter. 1 000 m2
- Table 3 Buildings permits in 2nd quarter 2006. Dwellings and utility floor space in dwellings, by type of building and county
- Table 4 Buildings permits in 2nd quarter 2006. Utility floor space, by type of building and county. 1 000 m2
- Table 5 Buildings work started in 2nd quarter 2006. Dwellings and utility floor space in dwellings, by type of building and county
- Table 6 Buildings work started in 2nd quarter 2006. Utility floor space, by type of building and county. 1000 m2
- Table 7 Buildings completed in 2nd quarter 2006. Dwellings and utility floor space in dwellings, by type of building and county
- Table 8 Buildings completed in 2nd quarter 2006. Utility floor space, by type of building and county. 1 000 m2
- Table 9 Buildings work started in 2nd quarter 2006. Dwellings by type of building and municipality
- Table 10 Buildings work started in 2nd quarter 2006. Utility floor space, by type of building and municipality
Contact
-
Jens Mathiesen
E-mail: jens.mathiesen@ssb.no
tel.: (+47) 40 81 13 98
-
Magnus Espeland
E-mail: magnus.espeland@ssb.no
tel.: (+47) 45 27 40 08


