Content
Published:
This is an archived release.
Decline within construction in 2009
The local kind-of-activity units in the construction industry had a turnover of NOK 311 billion in 2009. This is a decrease of 11.5 per cent compared to 2008.
The construction industry is divided into several divisions. The local kind-of-activity-units operating within construction of buildings experienced the largest decline in turnover, by 17 per cent. The total turnover in 2009 vas NOK 136 billion within this division. A total of 65 952 persons were employed, which is a decrease of 2.3 per cent compared to 2008.
Specialised construction activities
The turnover within this division experienced a decrease in turnover of 7 per cent compared to 2008, to a total of NOK 139 billion. The division employed 112 765 persons, which is approximately the same as in 2008. The number of persons employed account for 58 per cent of the total employment in the construction industry.
Civil engineering
This division experienced the smallest decrease in activity within the construction industry. The total turnover in 2009 was NOK 35 billion, which is a decrease of 5.3 per cent compared to 2008. The employment decreased by 4 per cent, to a total of 14 901 persons.
Statistics at enterprise level
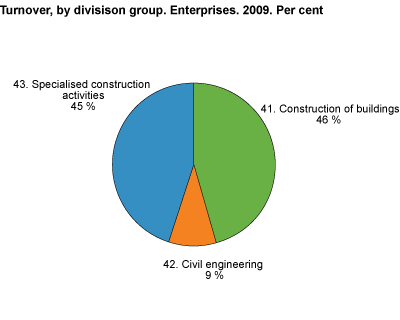
At enterprise level the turnover decreased by 12.2 per cent to NOK 309 billion within the construction industry.
Statistics on enterprise levelThe structural business statistics for construction are compiled on a local KAU level and on enterprise level. The figures on enterprise level may differ from figures on local KAU level. This is due to some enterprises being registered in one industry group according to main activity, while at the same time consisting of local KAUs in other groups. |
Tables:
- Table 1 Principal figures, by industry subclass. Local kind-of-activity units. 2008 and 2009
- Table 2 Principal figures, by number of persons employed and industry group. Local kind-of-activity units. 2009
- Table 3 Principal figures for the industrial section, by county. 2009
- Table 4 Principal figures, by industry subclass. Enterprises. 2008 and 2009
- Table 5 Principal figures, by number of persons employed and industry group. Entreprises. 2009
The statistics is now published as Business statistics.
Additional information
Contact
-
Statistics Norway's Information Centre
E-mail: informasjon@ssb.no
tel.: (+47) 21 09 46 42

