Content
Published:
This is an archived release.
Turnover up 6.9 per cent in construction
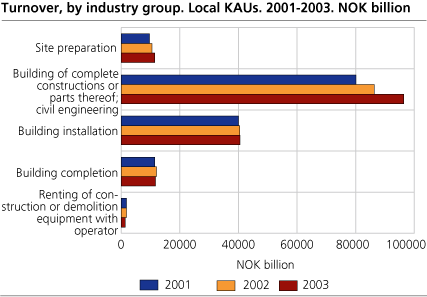
Turnover in local kind-of-activity units (KAUs) in the construction industry, including state- and municipal-owned units, amounted to NOK 161.6 billion in 2003 - an increase of 6.9 per cent from 2002.
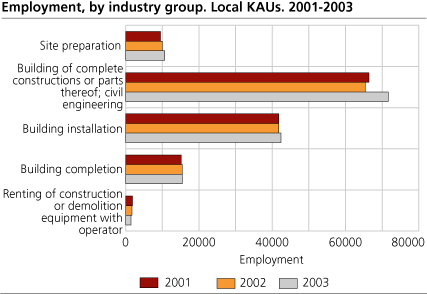
The 37 011 local KAUs in the construction industry employed 141 704 persons in 2003, an increase of 5.5 per cent from 2002. Wage costs increased by 9.1 per cent, and amounted to NOK 43.8 billion in 2003. All amounts exclude VAT.
Industrial classes
The construction industry is divided into several industry classes. The largest class is "General construction of buildings and civil engineering works". The total turnover of local KAUs in this industry class amounted to NOK 71.1 billion and employed 50 243 people in 2003, an increase of 5.4 and 5.7 per cent respectively. This industry class contributed to 44 per cent of the total turnover in the construction industry in 2003.
1.8 per cent of the local KAUs contributed to 44 per cent of the turnover
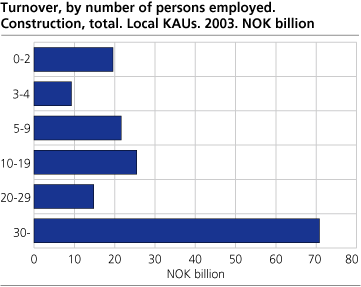
In 2003 the 648 local KAUs with 30 or more people employed, or 1.8 per cent of the total population, contributed to 44 per cent, or NOK 70.8 billion, of the total turnover in the construction industry. The 28 361 local KAUs, or 77 per cent of the total population, with 2 or fewer persons employed contributed to 12 per cent of the total turnover.
Mesta
From the 1 January 2003, the state road construction activity was sorted out as a state-owned enterprise called Mesta AS. Mesta AS is included in the figures from 2003. Mesta AS is placed within the industry group "Building of complete constructions or parts thereof; civil engineering".
Statistics on the enterprise level
The structural business statistics for constructions are compiled both on the local KAU level and on the enterprise level. On the enterprise level the turnover increased by 9 per cent and amounted to NOK 164.2 billion, and 142 419 people were employed in 2003.
The figures on the enterprise level may differ from those on local KAU level. This is due to some enterprises being registered in one industry group after main activity, while at the same time consisting of local KAUs in other groups. More about this and other definitions can be found in the "About the statistics".
Tables:
- Table 1 Principal figures, by industry subclass. Local kind-of-activity units. 2002 and 2003
- Table 2 Principal figures, by number of persons employed and industry group. Local kind-of-activity units. 2003
- Table 3 Principal figures for the industrial section, by county. 2003
- Table 4 Principal figures, by region and industry group. Local KAUs. 2003
- Table 5 Principal figures, by industry subclass. Enterprises. 2002 and 2003
- Table 6 Spesification of turnover, by different industry subclass, expressed in percentages. Enterprises. 2003
- Table 7 Principal figures, by number of persons employed and industry group. Entreprises. 2003
- Table 8 Investments, by group of fixed assets and industry subclass. Enterprises. 2003
- Table 9 Investments, by category and industry subclass. Enterprises. 2003
- Table 10 Number of births and deaths of enterprises, by inustry group. 2003
The statistics is now published as Business statistics.
Additional information
Contact
-
Statistics Norway's Information Centre
E-mail: informasjon@ssb.no
tel.: (+47) 21 09 46 42


