Content
Published:
This is an archived release.
Turnover of NOK 204 billion in construction
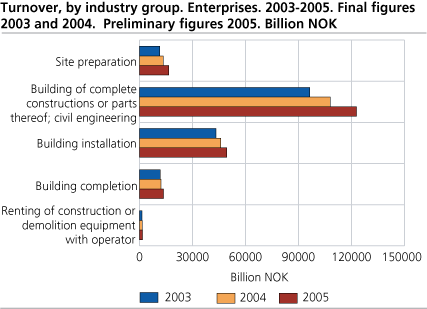
Preliminary figures show that the turnover for enterprises with building and construction as their main activity amounted to NOK 203.9 billion in 2005 - an increase of 12.7 per cent from 2004.
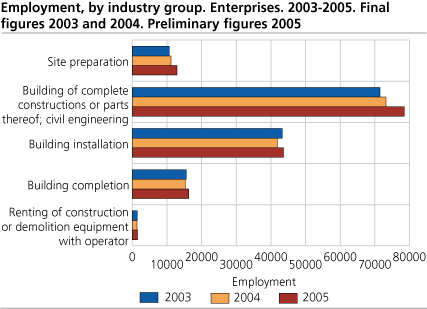
From 2004 the number of enterprises in the construction industry increased by over 1 800 to 38 559 enterprises in 2005. These enterprises employed a total of 152 816 persons in 2005, an increase of 6.9 per cent from 2004.
It is recorded an increase both in turnover and employment in all main industrial groups from 2004 to 2005. The largest growth is recorded in site preparation. In this group the turnover increased by 23.3 per cent from 2004, while the employment is 15.3 per cent higher compared with 2004.
Preliminary figures
Preliminary figures for structural statistics are published only on enterprise level. Figures for enterprises will generally show other values than the figures for local kind-of-activity units. The reason is that an enterprise that is registered with its main activity in one industry may have local kind-of-activity units with activity in other industries. The data have not been as thoroughly revised as they will be at the publishing of the final figures in May 2007.
|
Deviation between preliminary and final figures
Comparison between preliminary and final figures in 2002, 2003 and 2004 shows that the final figures for number of enterprises in the construction industry as a total have been between 0.5 and 0.8 per cent lower compared with preliminary figures. The final figures for turnover have been between 0.1 and 0.3 per cent lower than the preliminary figures. For employment and wages and salaries, the deviation between preliminary and final figures has been a little bit higher. The employment figures have been between 2.3 and 4.2 per cent lower at final figures in these three years. The figures over wages and salaries were 2.0 per cent higher when publishing final figures in 2003, while they were 3.4 per cent lower at final figures in 2004.
Uncertain gross investment figures
The prelimiary figures over gross investment in the construction industry are the most uncertain. These figures have been between 9.0 and 18.9 per cent higher at preliminary figures compared to final figures in 2002, 2003 and 2004. This is due to better information when estimating final figures. |
Tables:
The statistics is now published as Business statistics.
Additional information
Contact
-
Statistics Norway's Information Centre
E-mail: informasjon@ssb.no
tel.: (+47) 21 09 46 42


