Content
Published:
This is an archived release.
Construction turnover increased by 23 billion
From 2004 to 2005, the local kind-of-activity units in the construction industry increased the turnover by NOK 23 billion, or 12.9 per cent.
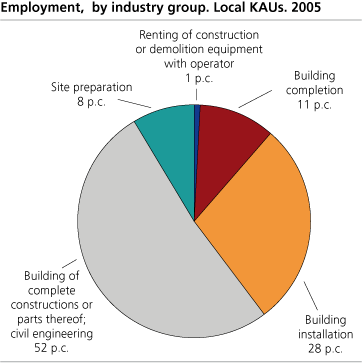
The 38 629 local kind-of-activity units (KAUs) in construction had a total turnover of NOK 201.6 billion and employed 145 099 persons in 2005. The total wage cost amounted to NOK 50.8 billion, up 10.4 per cent from 2004.
Site preparation increased the most
The construction industry is divided into several industry classes. It was the local KAUs with site preparation as their main activity that increased turnover most in 2005. Totally the 4 457 local KAUs in this industry class had a turnover of NOK 16.5 billion in 2005, up 22.8 per cent from the year before.
The largest subclass is "General construction of buildings". The total turnover of the local KAUs in this industry class amounted to NOK 79.3 billion and employed 45 401 people in 2005, an increase from 2004 of 15.8 and 3.9 per cent respectively. In 2005, this industry class contributed to 39 per cent of the total turnover in the construction industry.
2 per cent of the local KAUs contributed to 45 per cent of the turnover
In 2005, the 761 local KAUs with 30 or more persons employed, or 2 per cent of the total population, contributed to 45 per cent, or NOK 90.4 billion, of the total turnover in the construction industry. The 29 698 local KAUs, or 77 per cent of the total population, with 2 or fewer persons employed contributed to 12 per cent of the total turnover.
Statistics on the enterprise level
The structural business statistics for constructions are compiled both on the local KAU level and on the enterprise level. The figures on the enterprise level may differ from those on local KAU level. This is due to some enterprises being registered in one industry group after main activity, while at the same time consisting of local KAUs in other groups.
On the enterprise level, the turnover increased by 13.1 per cent and amounted to NOK 204.6 billion, and 146 461 people were employed in 2005.
More information and definitions can be found in the "About the statistics".
Tables:
- Table 1 Principal figures, by industry subclass. Local kind-of-activity units. 2004 and 2005
- Table 2 Principal figures, by number of persons employed and industry group. Local kind-of-activity units. 2005
- Table 3 Principal figures for the industrial section, by county. 2005
- Table 4 Principal figures, by region and industry group. Local KAUs. 2005
- Table 5 Principal figures, by industry subclass. Enterprises. 2004 and 2005
- Table 6 Spesification of turnover, by different industry subclass, expressed in percentages. Enterprises. 2005
- Table 7 Principal figures, by number of persons employed and industry group. Entreprises. 2005
- Table 8 Gross Investments, by group of fixed assets and industry subclass. Enterprises. 2005
- Table 9 Gross Investments, by category and industry subclass. Enterprises. 2005
- Table 10 Number of births and deaths of enterprises, by inustry group. 2005
The statistics is now published as Business statistics.
Additional information
Contact
-
Statistics Norway's Information Centre
E-mail: informasjon@ssb.no
tel.: (+47) 21 09 46 42


