Increased district heating and district cooling consumption
Published:
District heating consumption increased by 8.6 per cent in 2016 compared to the year before and amounted to a record high 5.2 TWh. Investment in district heating production and the further expansion of the district heating net has pushed up consumption over time.
- Full set of figures
- District heating and district cooling
- Series archive
- District heating and district cooling (archive)
In 2016, the total length of the district heating net was about 1 900 km – more than twice that of 2008.
Highest consumption in service industries
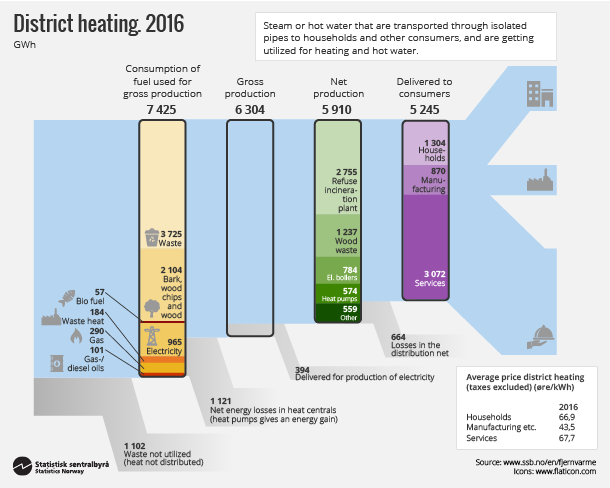
Service industries continued to account for the largest share of consumption in 2016, and their use of district heating accounted for about 3.1 TWh. Twenty-five per cent of the total district heating consumption, or about 1.3 TWh, was supplied to households, while consumption in industry accounted for 17 per cent, or 870 GWh.
Figure 2. Consumption of district heating by consumer group
| Households | Manufacturing etc. | Services | |
| 1992 | 254 | 237 | 540 |
| 1993 | 268 | 253 | 557 |
| 1994 | 240 | 295 | 596 |
| 1995 | 271 | 316 | 598 |
| 1996 | 300 | 333 | 665 |
| 1997 | 255 | 273 | 753 |
| 1998 | 269 | 247 | 861 |
| 1999 | 299 | 238 | 971 |
| 2000 | 211 | 235 | 1012 |
| 2001 | 300 | 219 | 1296 |
| 2002 | 304 | 282 | 1346 |
| 2003 | 346 | 295 | 1445 |
| 2004 | 381 | 289 | 1560 |
| 2005 | 395 | 300 | 1655 |
| 2006 | 445 | 301 | 1749 |
| 2007 | 512 | 324 | 1922 |
| 2008 | 661 | 326 | 1930 |
| 2009 | 692 | 369 | 2232 |
| 2010 | 1023 | 473 | 2804 |
| 2011 | 754 | 405 | 2571 |
| 2012 | 913 | 482 | 2828 |
| 2013 | 1054 | 581 | 3065 |
| 2014 | 967 | 616 | 2878 |
| 2015 | 1007 | 847 | 2977 |
| 2016 | 1304 | 870 | 3072 |
About half of district heating is generated from waste
The gross production of hot water and steam was 6.3 TWh in 2016. Of this, 394 GWh was used in the production of electricity. In total, net production of district heating was 5.9 TWh. Losses in the distribution net equalled 664 GWh, which means that 5.2 TWh of district heating was supplied to consumers. Please note that the definition of gross production of hot water and steam has changed this year. For more information about the changes please take a look at the information link at the end of the article.
Waste incineration is the main energy source for district heating. In 2016, about 50 per cent of district heating, or 2.8 TWh, was produced from waste. The second largest source of energy was waste wood facilities, with a share of around 21 per cent (1.2 TWh).
Figure 3. Net production of district heating by type of heat central. 2016
| Heat central | Percentage |
| Refuse incineration plant 2755 GWh | 46.6 |
| Biofuel 51 GWh | 0.9 |
| Oil boilers 66 GWh | 1.1 |
| Waste heat 184 GWh | 3.1 |
| Gas 258 HWh | 4.4 |
| Heat pumps 574 GWh | 9.7 |
| Electric boilers784 GWh | 13.3 |
| Wood waste1237 GWh | 20.9 |
District cooling
In addition to district heating, some of the plants supply district cooling. Consumption of district cooling came to 182 GWh in 2016; 7.7 per cent higher than the year before.
Figure 4. Consumption of district cooling
| GWh | |
| 2003 | 46 |
| 2004 | 53 |
| 2005 | 63 |
| 2006 | 73 |
| 2007 | 84 |
| 2008 | 99 |
| 2009 | 115 |
| 2010 | 120 |
| 2011 | 136 |
| 2012 | 133 |
| 2013 | 156 |
| 2014 | 169 |
| 2015 | 169 |
| 2016 | 182 |
Higher price
The average price for district heating increased from 58.0 øre/kWh in 2015 to 65.2 øre/kWh in 2016. For households and the service sector, the average price was 66.9 and 67.6 øre/kWh respectively, but industry was lower, at 43.5 øre/kWh. The price for cooling amounted to 94.5 øre/kWh in 2016, which is 7 per cent higher than 2015.
Increased district heating consumption and higher prices led to higher sales revenues from district heating in 2016. The revenues from district heating increased by 24 per cent compared to 2015 and amounted to NOK 3.3 billion. The revenue from district cooling was NOK 172 million; 15 per cent higher than the year before.
Contact
-
Thomas Aanensen
-
Ann Christin Bøeng
-
Statistics Norway's Information Centre

