Content
Published:
This is an archived release.
Higher electricity prices
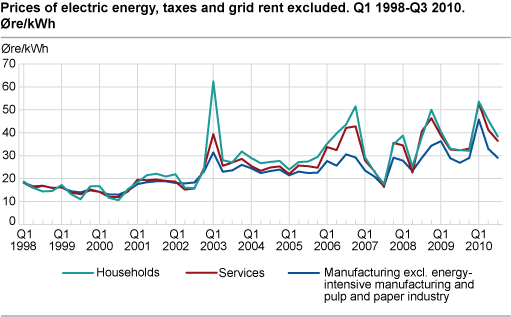
The average price of electricity, excluding grid rent and taxes, increased for all groups of consumer except energy-intensive manufacturing in the third quarter of 2010 compared to the third quarter of 2009. Compared to the second quarter this year, the electricity price was reduced for households, manufacturing and service industry.
The average price of electric energy for households was 38.4 øre/kWh, excluding grid rent and taxes, in the middle of the third quarter of 2010. The increase in the price of electricity can be viewed in conjunction with a low reservoir level in the third quarter. In week 31 the reservoir level was 12.2 percentage points lower than in the same week last year and 20 percentage points below the median week level (1990-2007).
Spot contracts less expensive
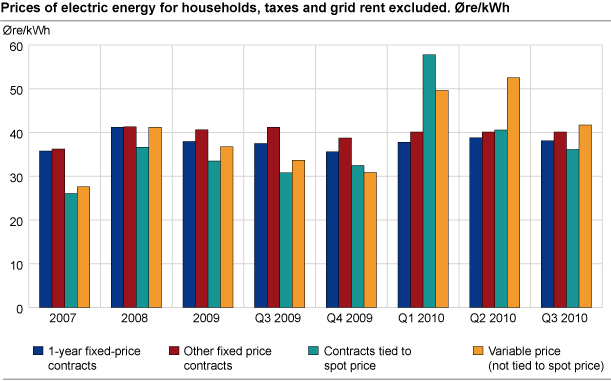
Households tied to spot price contracts paid 36.1 øre/kWh on average, excluding grid rent and taxes, in the third quarter of 2010, while the price of variable price contracts amounted to 41.7 øre/kWh. One-year fixed-price contracts and other fixed-price contracts totalled 38.1 and 40.1 øre/kWh respectively.
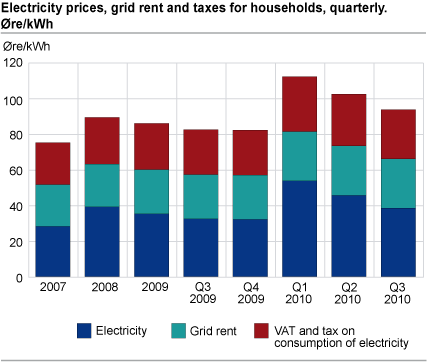
The overall average price of electricity for households, including grid rent and taxes, amounted to 93.5 øre/kWh in the third quarter. The grid rent and taxes came to 27.6 and 27.5 øre/kWh respectively.
Households chose spot contracts
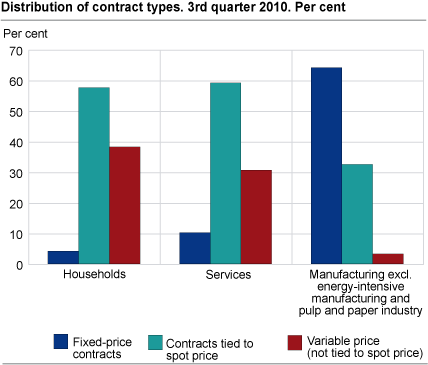
Spot price contracts were the most common type of contract for households, measured by the amount of electricity purchased, in the third quarter this year. Fifty-eight per cent of the electricity purchased by households came from spot price contracts. This is 3.9 percentage points higher compared to the third quarter of 2009. In the same period, the share of variable price contracts was reduced by 3.3 percentage points to 38.2 per cent. Fixed-price contracts amounted to 4.2 per cent in the third quarter this year; almost the same as in the third quarter of 2009. In the service industry, spot price contracts were the most common type of contract, while fixed-price contracts dominated in manufacturing.
Higher electricity prices for service industry and manufacturing excl. energy-intensive manufacturing and pulp and paper industry
The average price of electricity in the service industry was 36.5 øre per kWh, excluding taxes and grid rent, in the middle of the third quarter. This is 13 per cent higher compared to the same quarter one year ago.
In manufacturing excl. energy-intensive manufacturing and the pulp and paper industry, the average price in the third quarter amounted to 29.1 øre per kWh. This is 8 per cent higher compared to the same quarter in 2009.
Slight decrease in electricity prices for energy-intensive manufacturing and the pulp and paper industry
For energy-intensive manufacturing and the pulp and paper industry, the average price of electricity was 20.8 øre per kWh in the third quarter, excluding taxes and grid rent. This is 2 per cent lower than one year ago.
The measuring period for the third quarter of 2010 was week 31. The average elspot price for the whole quarter was 5.6 øre/kWh higher than the elspot price in week 31.
See also
Tables:
- Table 1 Electricity prices in the end-user market, quarterly. Exclusive VAT. øre/kWh
- Table 2 Electricity prices and grid rent for households, quarterly.
- Table 3 Range of electricity prices in end-user market and distribution of sold quantity in the sample
- Table 4 Time series covering quarterly and yearly prices of electric energy, taxes excluded. øre/kWh
- Table 5 Time series covering quarterly and yearly prices of electric energy for households, taxes included. øre/kWh
- Table 6 Electricity prices in the wholesale market, quarterly. øre/kWh
- Table 7 Time series covering quarterly and yearly prices of electric energy in the whole sale market, taxes excluded. øre/kWh
Contact
-
Thomas Aanensen
E-mail: thomas.aanensen@ssb.no
tel.: (+47) 40 90 23 48
-
Magne Holstad
E-mail: magne.holstad@ssb.no
tel.: (+47) 40 90 23 42
-
Robert Skotvold
E-mail: robert.skotvold@ssb.no
tel.: (+47) 40 90 24 44


