Content
Published:
This is an archived release.
Energy consumption fell
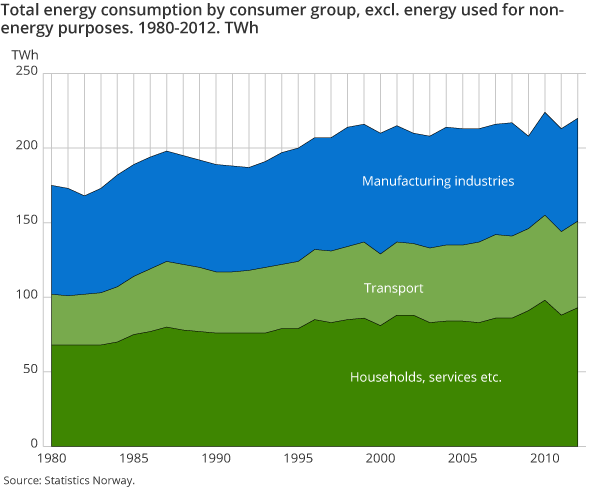
The total energy consumption in Norway fell by 5 per cent from 2010 to 2011. The reduction was especially high in households and services.
Within households and services, energy consumption fell by about 12 per cent from 2010 to 2011. Fuel wood, oil, electricity and district heating were all reduced.
Warmer weather gives lower energy consumption
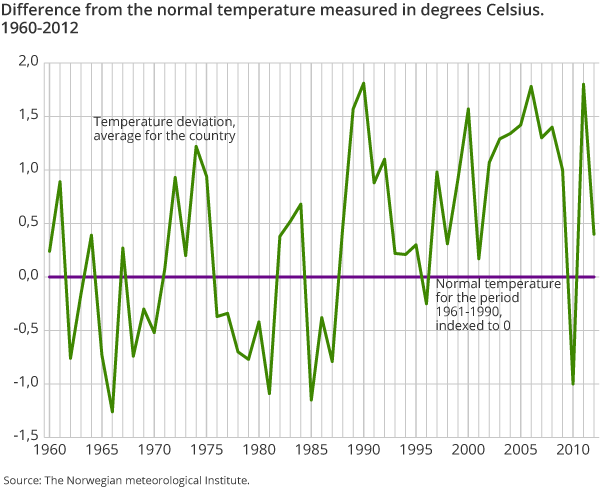
The drop in energy consumption in 2011 must be seen in connection with the fact that it was much warmer in 2011 than in 2010. 2011 was one of the warmest years on record, at 1.8 o C above the normal temperature for the period 1961-1990, while 2010 was the coldest year since 1985. This resulted in a record high consumption in 2010. In 2011, the energy consumption came to about 768 petajoule in total, excluding energy used as raw materials. This is about the same level as energy consumption in the past decade.
The households and services together consumed about 270 petajoule of energy in 2011. This makes up 35 per cent of the total energy consumption. In these groups, the energy consumption depends more on the outdoor temperature than other groups such as transport and industries, which are more dependent on economic growth and activity level.
Wood consumption in households
Slightly more than 1.3 million tonnes of wood was burned in Norwegian homes in 2011. In addition, over 200 000 tonnes of wood was burned in holiday homes during the same year. The consumption of wood in households last year was 11 per cent lower than in 2010. Half of the wood burned in 2011 was burned in enclosed stoves based on new technology (manufactured after 1998). Stoves based on new technology are more energy efficient than stoves based on old technology, which means that more heat is generated from each kilogram of wood from new stoves, and they emit less particulate matter. Forty-six per cent of the wood was burned in enclosed stoves based on old technology, while 4 per cent was burned in open fireplaces.
Stagnation in energy consumption in manufacturing industries
The total energy consumption in Norway has been around the same level since 2000. This is partly due to stagnation, or recession in manufacturing industries. Manufacturing accounts for about one third of our total energy consumption, and therefore impacts our total energy consumption. From 2000 to 2011, the energy consumption in manufacturing industries dropped by around 14 per cent. The large decline can especially be attributed to the financial crisis in 2009, which in particular harmed the energy-intensive industries that are exposed to competition from foreign companies. Furthermore, several energy-intensive industries have closed down over the last decade, while the remaining industries have been more energy efficient. The activity and energy consumption in manufacturing industries have increased somewhat since the financial crisis. However, it is still not as high as before the crisis. The energy consumption in the industries in 2011 was around the same level as in 2010; roughly 249 petajoule.
Energy-producing companies, such as refineries, are not counted as manufacturing industry companies in the energy balance, but as energy-producing industries.
Energy consumption for transport purposes
The energy consumption for transport purposes has seen a relatively high increase in recent years, by around 18 per cent from 2000 to 2011. From 2010 to 2011, there was however a slight reduction in the transport consumption, of 0.5 per cent. This was due to a reduction in energy used for road transport of about 1 per cent from 2010 to 2011. However, there was also an increase in energy consumption within coastal shipping in the same period.
Lower gas production but higher consumption
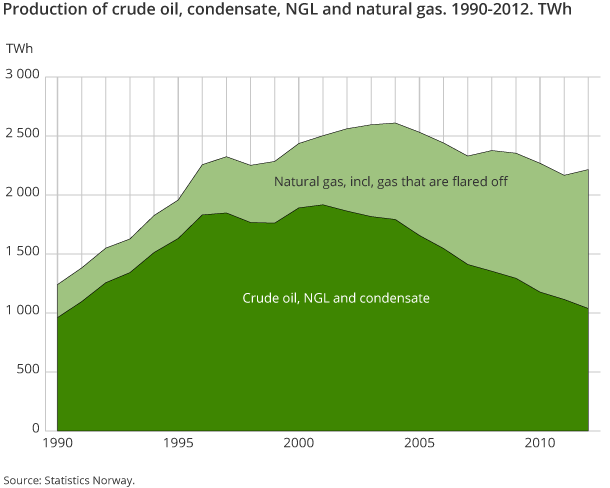
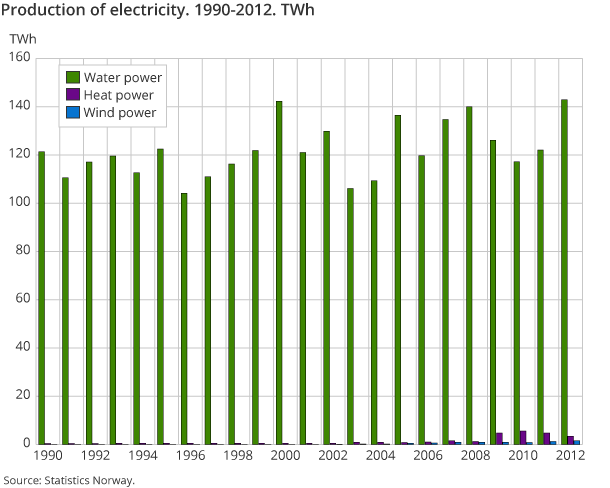
Crude oil and natural gas production both saw a decline from 2010 to 2011, by 7 and 4 per cent respectively. The main part of the produced oil and gas is exported, but the domestic use of natural gas has increased somewhat, both for final consumption and electricity production. While consumption of most energy products fell in 2011, the use of natural gas rose by 11 per cent from the previous year. The increase was most significant for industry and transport purposes. The establishment of gas power plants, among other places on Mongstad, Melkøya and Naturkraft, has meant greater use of natural gas for electricity production. For reasons of profitability, and due to temporary production stoppages at the plants, both the gas power production and the gas consumption fell somewhat in 2011.
.
This publication comprises both energy balance and energy account tables. These are based on more or less the same figures, but are presented according to different principles and definitions, where the energy accounts follow the definitions in the national accounts and the energy balance comprises the energy consumption on Norwegian territory. These tables therefore give different figures for energy consumption. For more details, see About the statistics. This text presents results from the energy balance. |
Tables:
- Table 1 Energy sources balance sheet for Norway. 2011. Preliminary figures
- Table 2 Energy balance sheet for Norway. 2011. Petajoule. Preliminary figures
- Table 3 Energy balance sheet for Norway. 2011. GWh. Preliminary figures
- Table 4 Energy accounts. Extraction, conversion and use of energy goods. 2011. Preliminary figures
- Table 5 Energy accounts. Use of energy goods outside the energy sectors, by industry. 2011. Preliminary figures
- Table 6 Energy accounts. Extraction, conversion and use of energy goods. 2011. Preliminary figures. PJ
- Table 7 Energy accounts. Extraction, conversion and use of energy goods. 2011. Preliminary figures. GWh
- Table 8 Energy sources balance sheet for Norway. 2010
- Table 9 Energy balance sheet for Norway. 2010. Petajoule
- Table 10 Energy balance sheet for Norway. 2010. GWh
- Table 11 Energy accounts. Extraction, conversion and use of energy goods. 2010
- Table 12 Energy accounts. Use of energy goods outside the energy sectors, by industry. 2010
- Table 13 Energy accounts. Extraction, conversion and use of energy goods. 2010. PJ
- Table 14 Energy accounts. Extraction, conversion and use of energy goods. 2010. GWh
- Table 15 Energy use in Norway 1998-2011, exclusive international maritime transport and commodities used as raw materials. Renewable and non-renewable energy. TWh and per cent
- Table 16 Net consumption of individual energy products. 1976-2011*
- Table 17 Energybalance 1999- 2011*. Petajoule
- Table 18 Percentage share of energy consumption, by individual energy commodities. 1998-2011*
- Table 19 Energy consumption in households, incl. holiday cottages. 1990-2011*
- Table 20 Energy consumption in households and holiday cottages. 1990-2011*. GWh
- Table 21 Average electricity prices and prices of selected petroleum products1. Excluding and including taxes. 1993-2011
- Table 22 Calculated prices of utilized energy. 1978-2011. Fixed 1998-prices. øre/kWh. All taxes included
- Table 23 Energy balance, total energy 2000-2011. GWh
- Table 24 Supply and use of electricity 1998-2011. GWh
The statistics is now published as Production and consumption of energy, energy balance and energy account.
Additional information
The statistics are published in spring and autumn. The spring publication is preliminary and aggregated to a larger degree, and only includes figures for energy balance. In the autumn publication, tables are also presented for the energy accounts.
Contact
-
Statistics Norway's Information Centre
E-mail: informasjon@ssb.no
tel.: (+47) 21 09 46 42

