Content
Published:
This is an archived release.
Use of energy decreased
According to preliminary figures the total energy use in manufacturing, mining and quarrying was 78,195 GWh in 2002. This is a fall of 6.5 per cent from the previous year. Total energy costs decreased by 8.4 per cent to 11.9 NOK billion.
The use of purchased energy fell by 6.3 per cent to 62,136 GWh in 2002, while the use of self-produced energy fell by 7.2 per cent to16,095 GWh. This is a result of lower production in the manufacturing sector.
The energy-intensive sector, which covers manufacture of basic metals, basic chemicals and the paper industry, accounted for 71 per cent of the total energy use in manufacturing, mining and quarrying in 2002. The energy use in these industries fell by 6.3 per cent compared with the previous year. Other sectors such as manufacture of petroleum products, chemical products, products of wood, food products and non-metallic mineral products had a decrease in energy consumption as well.
Products of gas - the second largest energy source
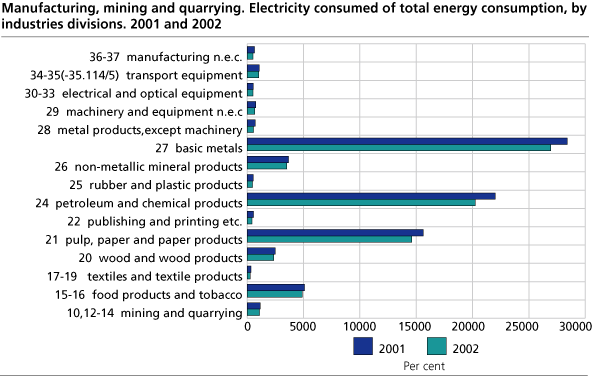
Electricity was the dominating energy source in most industries and accounted for 59.1 per cent of total energy consumption in 2002. The use of electricity was 46,267 GWh. Of the industries in the manufacturing sector the electricity consumption was largest in the metal industries. Metal industries accounted for 54.5 per cent of total electricity consumption in manufacturing, mining and quarrying in 2002. In this sector the electricity use decreased by 3.7 per cent compared with previous year.
Purchased and self-produced gas together accounted for more than the petroleum products last year and was the number two energy source in manufacturing, mining and quarrying. The total consumption of gas was 9,765 GWh while total consumption of oil products was 8,272 GWh in 2002. Nearly all the petroleum products were purchased, while the gas products mostly were self produced. Manufacture of petroleum products, chemical products and basic chemicals accounted for most of the gas consumption. Together with the manufacture of basic metals, food products, non-metallic mineral products and the paper industry they accounted for most of the consumption of petroleum products as well.
About half of the energy use in the industry of wood, pulp and paper was covered by self-produced wood waste and black liquor. Electricity covered the rest of the energy consumption in these industries. Both purchased and self-produced energy declined in these sectors compared with 2001.
The consumption of coal products fell in 2002. Only manufacture of non-metallic mineral products used this energy source this year. The total consumption of coal products was 1,352 GWh.
Prices of energy decreased in 2002
Companies engaged in manufacturing, mining and quarrying paid on average 17.5 øre per kWh for purchased energy used in 2001. This represented a decrease of 0.4 øre from the previous year - all prices are stated exclusive of value-added tax. The fall in the energy costs may be explained by a decrease in electricity prices in energy-intensive sectors such as basic metals and the paper industry. The average price of electricity fell by 0.3 øre to 17.4 øre per kWh. Most of the other energy products had a fall in the price as well.
The price the industries paid for electricity varied. The manufacturing of textiles had the highest electricity price for the sectors within manufacturing - 43.1 øre per kWh for the electricity in 2002. The metal industry had the lowest electricity price, at an average of 12.7 øre per kWh. This may be explained by different contract of sale between purchaser and seller of electricity in different sectors.
Tables:
- Table 1 Energy consumption in establishments in manufacturing, mining and quarrying. Overview. 2002
- Table 2 Energy consumption in establishments in manufacturing, mining and quarrying, by industry subclass and energy type. Quantity. 2002
- Table 3 Energy consumption in establishments in manufacturing, mining and quarrying, by industry subclass and energy type. GWh. 2002
- Table 4 Energy costs in establishments in manufacturing, mining and quarrying, by industry subclass and energy type. Million NOK. 2002
- Table 5 Energy prices, by industry subclass and energy type. 2002
- Table 6 Energy consumption in establishments in maufacturing, mining and quarrying. Overview. Final figures. 2001
- Table 7 Energy consumption in establishments in manufacturing, mining and quarrying, by industry subclass and energy type. Quantity. Final figures. 2001
- Table 8 Energy consumption in establishments in manufacturing, mining and quarrying, by industry subclass and energy type. GWh. Final figures. 2001
- Table 9 Energy costs in establishments in manufacturing, mining and quarrying, by industry subclass and energy type. Million NOK. Final figures. 2001
- Table 10 Energy prices, by industry subclass and energy type. Final figures. 2001
Contact
-
Tove Helene Løvbak
E-mail: tove.lovbak@ssb.no
tel.: (+47) 40 02 08 94
-
Ingunn Ruud
E-mail: ingunn.ruud@ssb.no
tel.: (+47) 48 99 65 63

