Content
Published:
This is an archived release.
Minor changes in manufacturing
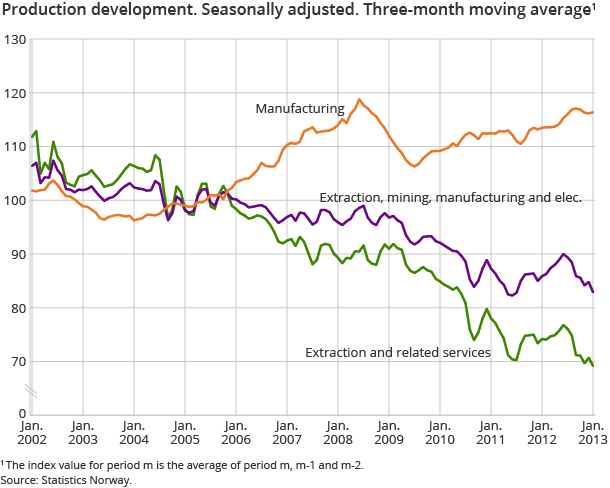
Production in Norwegian manufacturing went down by 0.4 per cent from November 2012 to January 2013 compared with the previous three-month period, according to seasonally-adjusted figures. The (overall) index of industrial production (PII) decreased due to a fall in extraction of crude oil and natural gas in this period.
| Seasonally adjusted | Calender adjusted1 | Weights2 | ||
|---|---|---|---|---|
| Monthly change | Three-month change | Twelve-month change | ||
| January 2013 / December 2012 | November 2012 - January 2013 / August 2012 - October 2012 | January 2013 / January 2012 | ||
| 1Adjusted for working-days and for public holidays in Norway. | ||||
| 2The weights are updated annually, and are valid for the entire year. | ||||
| Extraction, mining, manufacturing and elec | -4.0 | -3.2 | -7.5 | 100.0 |
| Extraction and related services | -1.6 | -2.7 | -8.1 | 72.5 |
| Mining and quarrying | -12.0 | 7.9 | -14.6 | 0.6 |
| Manufacturing | 0.3 | -0.4 | 2.4 | 20.8 |
| Food, beverage and tobacco | -3.5 | -0.3 | -0.1 | 3.9 |
| Refined petro., chemicals, pharmac. | -0.2 | -2.3 | -2.8 | 2.1 |
| Basic metals | 1.6 | -2.1 | -2.6 | 1.1 |
| Machinery and equipment | 1.0 | 3.1 | 14.7 | 2.9 |
| Ships, boats and oil plattforms | -1.4 | 3.6 | 14.0 | 2.2 |
| Electricity, gas and steam | -2.0 | -5.6 | -4.5 | 6.1 |
Extraction of crude oil went down by 3.0 per cent, while extraction of natural gas decreased by 2.1 per cent from November 2012 to January 2013 compared with the previous three-month period, according to seasonally-adjusted figures. This was related to technical difficulties in several fields on the Norwegian continental shelf.
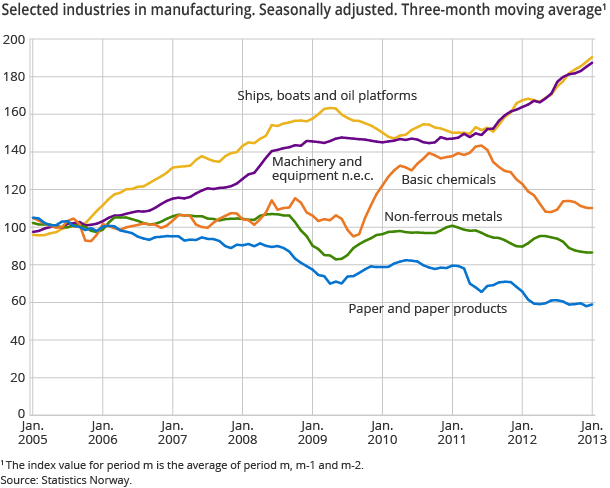
The gap within Norwegian manufacturing continues to increase. Seasonally-adjusted figures from November 2012 to January 2013 shows a further increase in output for industries such as machinery and equipment, and ships, boats and oil platforms. On the other hand, industries like basic chemicals and basic metals experienced a downturn in production. The differences between industries linked to the Norwegian oil and gas industries, and more traditional Norwegian export industries have thereby continued to increase. In addition, there has also been a decline in the production of food and food products, and wood and wood products from November 2012 to January 2013 compared with the previous three-month period, according to seasonally-adjusted figures.
Increase in manufacturing from January 2012 to January 2013
The output in manufacturing saw a growth of 2.4 per cent from January 2012 to January 2013 according to calendar adjusted figures. Industries like machinery and equipment, together with ships, boats and oil platforms had a strong production growth, while basic chemicals had a clear drop in production in the same period.
Minor changes in manufacturing from December 2012 to January 2013
The production in Norwegian manufacturing went up by 0.3 per cent from December 2012 to January 2013, according to seasonally-adjusted figures. There has been an increase in production of non-ferrous metal and basic chemicals, while food and food products saw a decline in production.
Norway and the euro area
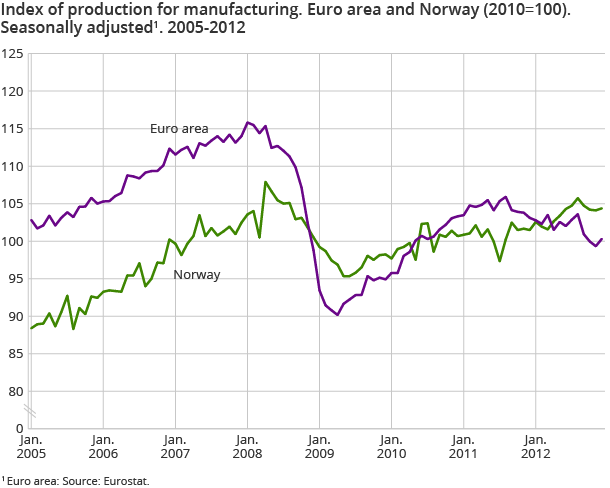
There was a 2.9 per cent increase in Norwegian manufacturing output from December 2011 to December 2012, according to calendar adjusted figures. Industrial production in the euro area decreased by 2.9 per cent in the same period, according to figures published by Eurostat.
Decrease in production within electricity supply from January 2012 to January 2013
The production within Norwegian electricity supply decreased by 4.5 per cent from January 2012 to January 2013, according to unadjusted figures.
Interpretation of seasonally-adjusted figuresOpen and readClose
In order to facilitate the interpretation of the short-term development, the index of production publishes three-month moving averages of the seasonally-adjusted figures. We normally compare the latest non-overlapping three-month periods, for instance November 2012 to January 2013 compared with August October 2012. Seasonally-adjusted monthly changes must be interpreted with caution.
Updated weights in the PIIOpen and readClose
PII is calculated as a weighted average of the volume changes. For the index to best reflect the industrial structure in Norway at a given time, the weights are updated by the transition to a new year. The new weights will thus have an effect on the index as of January. Industries that get a larger weight will have a stronger effect on the development, while changes in volume for industries with lower weights have less significance in the aggregation.
The weights in the industries of paper and paper products, basic chemicals, and computer and electrical equipment were among the industries that had the largest drop in weights from 2012 to 2013. Industries such as machinery and equipment, and ships, boats and oil platforms were among the industries that increased the most. The reasons for the higher weights are the increased deliveries to oil and gas activities. The weights for extraction and related services increased from 2012 to 2013 as a result of increased weights for both crude petroleum and natural gas, and extraction services.
The basis for PIIs’ weights is value added at factor prices from the annual structure statistics for oil and gas, manufacturing, electricity and district heating. All changes in weight are due to a combination, in varying degrees, of changing costs, sales volumes and prices. The value added figures are updated to the situation at the end of 2012 with rates of change from the quarterly national account.
Contact
-
Production and turnover
E-mail: prodoms@ssb.no


