Content
Published:
This is an archived release.
Development in manufacturing flattened of
The main figures for manufacturing increased less than in the previous year. Increases in gross value of production and value added were less than for 2000, and gross investments increased slightly. The employment in manufacturing continued to decrease.
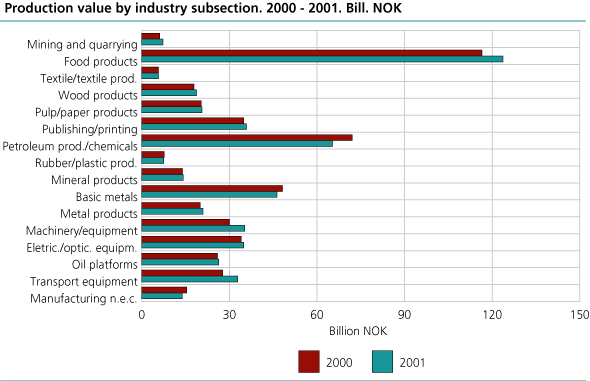
The gross value of production went up by NOK 13.1 billion or 2.6 per cent from 2000 to 2001 and totalled NOK 509.6 billion measured in current prices. Costs of goods and services consumed increased at the same rate as production and totalled 358.2 billion in 2001.
In production of basic chemicals and refined petroleum products, production value fell by as much as NOK 7 billion in 2001 compared with 2000. This is due to lower production and a planned break in production for a month by one of the refineries. The second largest decrease came in the metal industry, which went down by NOK 1.9 billion
The largest increases in production values occurred within meat and meat products, production of machineries and equipment and for production of transport equipment, such as ships. Among these the largest increases were in costs of goods and services consumed, even though they went up less than the production value.
Slightly increased value added
Value added measured in market prices increased by only 1.4 per cent in 2001, in spite of the fact that production increased by 2.6 per cent. This is partly due the increase in the costs measured by product input, i.e. without wage costs. Value added amounted to NOK 149.4 billion in 2001 for manufacturing, mining and quarrying, about 2 billion more than in 2000.
The total wage costs went up by only 2.2 per cent from 2000 to 2001, while the increase in wage cost per employee was 5.8 per cent. This can be explained by the weak employment trend.
Investments flattened out
After the decline in 1999 and 2000, a total decline of NOK 5.7 billion, the investments went up by NOK 1 billion in 2001. The level of investments is, however, still comparatively low.
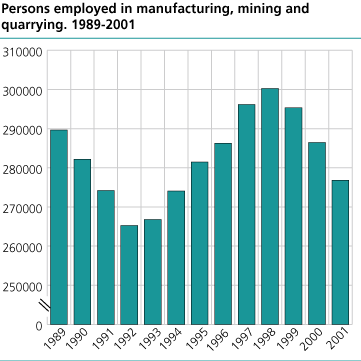
Employment in industry fell by nearly 10 000 from 2000 to 2001, a decline of 2.6 per cent. The employment figures are lower than the preliminary figures for year 2001.
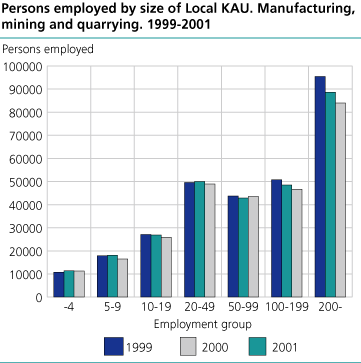
The drop in employment occurred in the largest companies and among the companies with between 5 and 10 persons employed. On the other hand, for companies with between 50 and 100 persons employed employment increased.
Most industries experienced declining employment during 2001. The employment reduction was particularly high within publishing and printing and production of furniture, where it fell by 1,850 and 1,150 persons from 2000 to 2001.
Tables:
- Table 1 Mining, quarrying and manufacturing. Principal figures for local kind of activity units. 1972-2001
- Table 2 Mining, quarrying and manufacturing. Principal figures for local kind of activity units, by industry division. 1997-2001
- Table 3 Mining, quarrying and manufacturing. Principal figures for local kind of activity units. County. 2000-2001
The statistics is now published as Business statistics.
Contact
-
Statistics Norway's Information Centre
E-mail: informasjon@ssb.no
tel.: (+47) 21 09 46 42


