Content
Published:
This is an archived release.
Steep rise in household income among the elderly – smaller rise among the young
Elderly households had an income rise of 21 per cent from 2009 to 2014. Couples with young children saw their household income rise 8 per cent in the same period.
| After tax median income | Per cent2 | ||
|---|---|---|---|
| 2014 | 2013 - 2014 | 2009 - 2014 | |
| 1Students not included | |||
| 2In constant prices | |||
| All households | 478 700 | 1.0 | 10.8 |
| Singles under 45 years | 275 000 | 0.7 | 5.5 |
| Singles 45-64 years | 309 200 | 1.1 | 10.5 |
| Singles 65 years and older | 248 400 | 2.1 | 17.4 |
| Couples without children, oldest person under 45 years | 569 100 | 1.0 | 1.5 |
| Couples without children, oldest person 45-64 years | 707 600 | 2.0 | 16.3 |
| Couples without children, oldest person 65 years and older | 533 100 | 2.2 | 21.1 |
| Couples with children 0-6 years | 721 700 | 1.1 | 8.2 |
| Couples with children 7-17 years | 831 400 | 1.4 | 11.8 |
| Couples with children, oldest child 18 years and older | 924 600 | 1.6 | 14.1 |
| Single mother/father with children 0-17 years | 391 600 | 0.7 | 5.5 |
| Single mother/father with children 18 years and older | 513 300 | 1.0 | 10.1 |

Average household income rose by 1.8 per cent in 2014, while median income rose 1 per cent. This was a weaker growth than in the previous year, when average and median income rose by 2.5 and 1.9 per cent – all figures in fixed prices. In 2014, median household after-tax income was NOK 478 700, while average income was NOK 563 700.
Households with the most elderly members had the strongest rise in median household income. Couples without children (oldest person 65 years or older) had an increase in income in real terms of 21.1 per cent from 2009 to 2014. The corresponding income rise for all households was 10.8 per cent. Pensioners living alone and couples without children (oldest person aged 45-64 years) also had an income rise that was stronger than the general income growth.
Single people under 45 years, young couples without children, couples with young children and single parents had the weakest income growth between 2009 and 2014. The increase in these household groups’ median household income was well below the overall income growth.
Higher income inequality
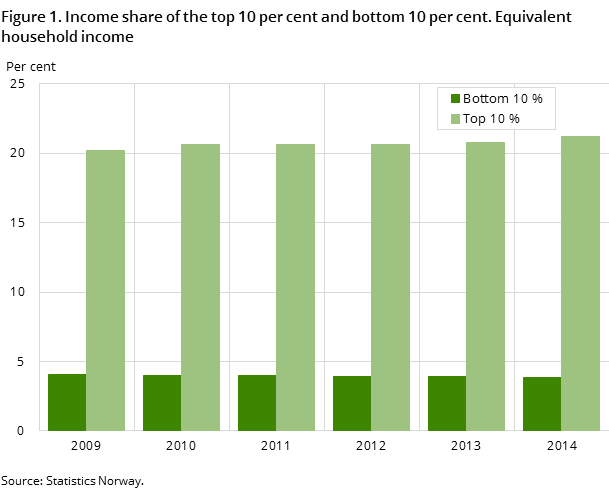
The share of total household equivalent income received by the top decile was 21.2 per cent in 2014. This was an increase of 0.5 percentage points from the previous year. The share of income received by the bottom decile was 3.8 per cent in 2014 – down from 3.9 per cent in 2013. Other summary measures of inequality also show a more uneven income distribution. The Gini coefficient, which is a standard measure of income inequality, increased from 0.241 in 2013 to 0.247 in 2014.
The rise in income inequality in 2014 may be explained by a strong growth in property income, in particular dividends, which to a large extent are received by households at the top end of the distribution. In recent years, the income growth of households at the bottom of the income distribution has been significantly weaker than the general income growth. Many persons in the lowest income decile have an immigrant background. In the period 2004-2014, the proportion of persons in the lowest income class with an immigrant background doubled from 23 to 46 per cent. Households at the bottom of the income distribution often have a weak attachment to the labour market, and many are dependent on various social welfare transfers.
Net wealth highly skewed
The net worth of households consists of the sum of financial and non-financial wealth, minus liabilities. The distribution of net worth is highly skewed. Households in the highest 10 per cent for net worth owned 50.2 per cent of the total net worth in 2014. This was up from 49.5 per cent in 2013. The richest 1 per cent owned 19 per cent of the total net worth, while the richest 0.1 per cent of all households owned 8.8 per cent of the total net worth in 2014. In 2013, the corresponding figures were 18.3 and 8.3 per cent. The higher concentration of net wealth in the top end of the distribution can partly be explained by a strong increase in market values on shares, unit trusts, bond and money market funds. These types of financial capital are to a large extent owned by the wealthiest households.
Contact
-
Jon Epland
E-mail: jon.epland@ssb.no
tel.: (+47) 92 61 69 08
-
Elisabeth Løyland Omholt
E-mail: elisabeth.omholt@ssb.no
tel.: (+47) 93 05 55 28
-
Christian Brovold
E-mail: christian.brovold@ssb.no
tel.: (+47) 91 75 31 32
-
Lene Sandvik
E-mail: lene.sandvik@ssb.no
tel.: (+47) 90 13 16 16
