Content
Published:
This is an archived release.
Diminishing family allowances
Norwegian families with children received a total of NOK 35.2 billion in cash transfers in 2013. In real terms, this was about the same amount as the year before. Payments of family allowances and cash for care were lower than in 2012, while payments of parental benefit on birth increased.
| Recipients (persons) | Cash transfers (NOK mill.) | Percentage change in fixed amounts | Percentage change in fixed amounts | |
|---|---|---|---|---|
| 2012 - 2013 | 2007 - 2013 | |||
| 1Holiday pay from parental benefit on birth and parental benefit on adoption is not included. | ||||
| 2Municipal cash for care is not included | ||||
| 2013 | ||||
| Total cash transfers | 769 000 | 35 212 | 0.0 | 4.9 |
| Parental benefit on birth1 | 143 500 | 15 746 | 2.0 | 35.8 |
| Maternity grant on birth and adoption | 9 800 | 344 | -2.9 | -24.2 |
| Family allowances | 704 800 | 14 956 | -1.5 | -7.7 |
| Cash for care2 | 50 500 | 1 176 | -5.8 | -46.5 |
| Transitional benefit | 27 800 | 2 495 | -2.8 | -0.6 |
| Child care benefit | 27 300 | 370 | -1.6 | -30.3 |
| Education benefit | 3 900 | 57 | 3.4 | -27.3 |


Cash transfers to families with children consist of:
- parental benefit on birth
- maternity grant on birth and adoption
- family allowances
- cash for care
- transitional benefit
- child care benefit
- education benefit to single providers
Among the different payments, parental benefit on birth constituted the largest sum in 2013, with NOK 15.7 billion.
Less in family allowances
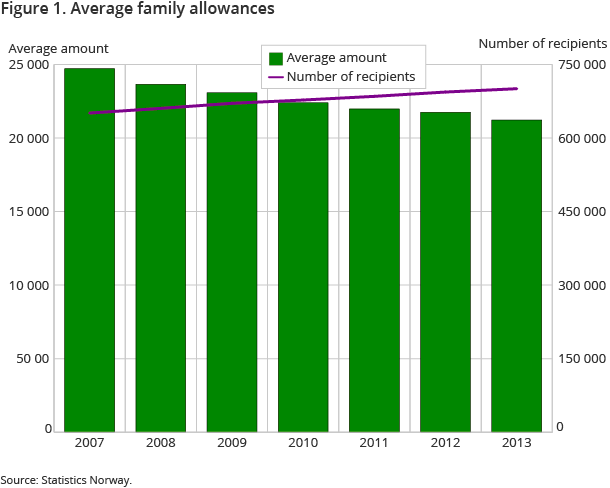
In 2013, the payments of family allowances amounted to NOK 15 billion. This was 1.5 per cent lower than in 2012, measured in constant prices. In comparison, payments of family allowances amounted NOK 16.2 billion in 2007, measured in real terms, and the payments thus decreased by eight per cent from 2007 to 2013. As illustrated in figure 1, the average amount received per recipient also decreased during this time – from NOK 24 700 in 2007 to NOK 21 200 in 2013. This represented a decrease of 14 per cent. While the payments of family allowances fell, the number of recipients increased. From 2007 to 2013, the number of recipients increased by about 50 000, and from 2012 to 2013, the number of recipients increased by 7 000.
Men received more parental benefit
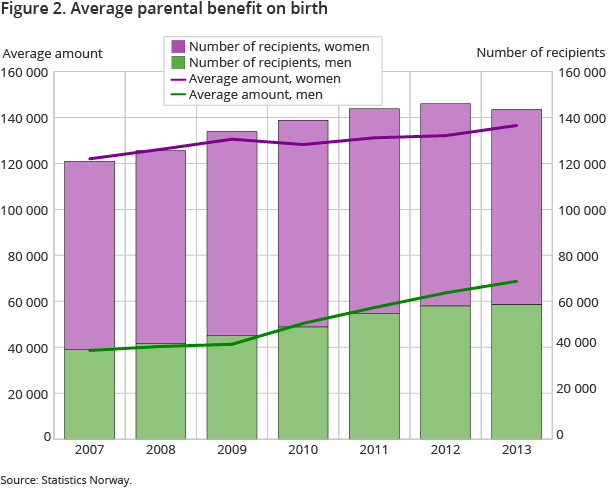
Parental benefit on birth constituted the largest payment among the different cash transfers to families with children in 2013. In total, NOK 15.7 billion was paid in 2013; an increase of two per cent from 2012, measured in current prices. Since 2007, the total payments of parental benefit on birth have increased by 36 per cent, or NOK 4.2 billion. This can largely be explained by the increase in the duration of the benefit period in recent years and the extension of the paternity leave for fathers. The average amount that recipients of parental benefit received also increased from 2007 to 2013, for both men and women. This is illustrated in figure 2. At the same time, the amounts received by fathers have increased compared to the amounts received by mothers. In 2007, women who received parental benefit on birth received on average three times as much as men receiving the same transfer. By 2013, this was reduced to twice as much.
Fewer recipients of cash for care
The total payments of cash for care have decreased in recent years, and constituted about NOK 1.2 billion in 2013. Measured in current prices, this was about NOK 70 million less than in 2012. From 2007 to 2013, the payments of cash for care decreased by about NOK 1 billion, or 47 per cent. At the same time, the number of recipients also decreased. Since 2007, the number of recipients has been reduced by 45 per cent, or 40 600 persons. About 50 500 persons received cash for care in 2013, and this was about 21 per cent less than the previous year. The significant reduction in the number of recipients in the past year is mainly due to the fact that provision of cash for care for two-year olds was discontinued in August 2012 (the statistics do not include municipal cash for care, which is provided by some municipalities). Simultaneously, the rates for the younger children increased, and measured in real terms, the average amount of cash for care received per recipient increased from 2012 to 2013, by 19 per cent, or NOK 3 700.
Families in Oslo received most
The average payments of cash transfers per child varied across the different counties in 2013. Families with children living in Oslo received the highest average amount of cash transfers per child; NOK 38 100. One reason for this is that single providers in Oslo have more children on average than single providers in the other counties and they also receive more in cash for care. The average payments per child were lowest in the county of Hedmark, with NOK 28 100 in 2013.
All amounts in constant prices Open and readClose
All amounts in this article are measured in constant prices and thus adjusted for the changes in the consumer price index (CPI).
Additional information
The statistics are based on information from the Norwegian Labour and Welfare Administration (NAV) and the Norwegian Tax Administration.
Contact
-
Statistics Norway's Information Centre
E-mail: informasjon@ssb.no
tel.: (+47) 21 09 46 42
