Decline in grouse bag
Published:
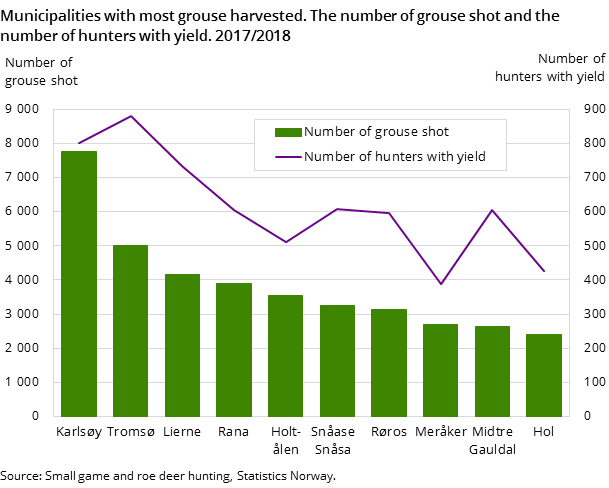
A total of 167 000 grouse were harvested in the hunting year 2017/2018, a decrease of 8 per cent from the previous hunting year. The decline is caused by reduced yields in the counties of Troms and Finnmark.
- Full set of figures
- Small game and roe deer hunting
- Series archive
- Small game and roe deer hunting (archive)
In total, 107 000 willow ptarmigan and 60 000 rock ptarmigan were harvested, according to the statistics Small game and roe deer hunting.
The grouse is the most harvested small game in Norway. The annual harvesting of grouse declined from over half a million in the hunting year 1999/2000 to 120 000 in the hunting year 2012/2013, which was a record low. This huge decline can be attributed to several factors. As a result of the decreasing population of grouse, the landowners in many places have limited the number of hunters, and bag limits have been applied. In other places, hunting has been discontinued. Reduced hunting pressure because of the restrictions may partly explain the decrease.
Totally 65 000 grouse were bagged in the counties of Nordland, Troms and Finnmark in the hunting year 2017/2018, which is a decrease of 31 per cent from the hunting year before. In the southen part of Norway the bag increased by 16 per cent.
Figure 1. Number of grouse harvested
| Hunting year | Number of felled |
| 2000/2001 | 489900 |
| 2001/2002 | 482000 |
| 2002/2003 | 415000 |
| 2003/2004 | 443900 |
| 2004/2005 | 450300 |
| 2005/2006 | 364300 |
| 2006/2007 | 312200 |
| 2007/2008 | 323100 |
| 2008/2009 | 224900 |
| 2009/2010 | 164200 |
| 2010/2011 | 194700 |
| 2011/2012 | 229000 |
| 2012/2013 | 119900 |
| 2013/2014 | 151600 |
| 2014/2015 | 222400 |
| 2015/2016 | 175000 |
| 2016/2017 | 181900 |
| 2017/2018 | 166800 |
Figure 3. Yield of wild boar
| Hunting year | Wild boar |
| 2014/2015 | 70 |
| 2015/2016 | 120 |
| 2016/2017 | 150 |
| 2017/2018 | 226 |
1 Estimated yield for the hunting years 1971/1972-2000/2001
Figure 4. Number of mountain hare and red fox harvested¹
| Hunting year | Mountain hare | Red fox |
| 1971/1972 | 74000 | 44000 |
| 1972/1973 | 76000 | 48000 |
| 1973/1974 | 63000 | 52000 |
| 1974/1975 | 72000 | 67000 |
| 1975/1976 | 56000 | 38000 |
| 1976/1977 | 50000 | 29000 |
| 1977/1978 | 61000 | 43000 |
| 1978/1979 | 64000 | 52000 |
| 1979/1980 | 47000 | 41000 |
| 1980/1981 | 63000 | 40000 |
| 1981/1982 | 74000 | 38000 |
| 1982/1983 | 72000 | 27000 |
| 1983/1984 | 94000 | 29000 |
| 1984/1985 | 127300 | 30300 |
| 1985/1986 | 116800 | 30100 |
| 1986/1987 | 116800 | 24700 |
| 1987/1988 | 124300 | 17900 |
| 1988/1989 | 125800 | 19400 |
| 1989/1990 | 125700 | 18300 |
| 1990/1991 | 105500 | 12700 |
| 1991/1992 | 115100 | 18700 |
| 1992/1993 | 76700 | 14000 |
| 1993/1994 | 70400 | 14200 |
| 1994/1995 | 58900 | 14600 |
| 1995/1996 | 51000 | 15100 |
| 1996/1997 | 43200 | 15600 |
| 1997/1998 | 43100 | 16600 |
| 1998/1999 | 38600 | 16400 |
| 1999/2000 | 42600 | 17900 |
| 2000/2001 | 32800 | 16800 |
| 2001/2002 | 28600 | 16200 |
| 2002/2003 | 24200 | 19300 |
| 2003/2004 | 28500 | 18300 |
| 2004/2005 | 29300 | 19400 |
| 2005/2006 | 25000 | 21100 |
| 2006/2007 | 22900 | 18200 |
| 2007/2008 | 24600 | 19600 |
| 2008/2009 | 23300 | 20100 |
| 2009/2010 | 20400 | 18800 |
| 2010/2011 | 19900 | 23900 |
| 2011/2012 | 20500 | 27700 |
| 2012/2013 | 13900 | 23700 |
| 2013/2014 | 15500 | 21400 |
| 2014/2015 | 17600 | 22400 |
| 2015/2016 | 15600 | 21300 |
| 2016/2017 | 14200 | 21000 |
1 Estimated yield for the hunting years 1971/1972-2000/2001.
Figure 5. Yield of woodland bird¹
| Hunting year | Capercaillie | Black grouse | Hazel grouse |
| 1991/1992 | 18650 | 50620 | 8250 |
| 1992/1993 | 15880 | 34030 | 6320 |
| 1993/1994 | 16420 | 42030 | 7070 |
| 1994/1995 | 12480 | 29010 | 4280 |
| 1995/1996 | 12080 | 25980 | 2930 |
| 1996/1997 | 10790 | 23580 | 3340 |
| 1997/1998 | 13840 | 31190 | 3620 |
| 1998/1999 | 12850 | 32540 | 5610 |
| 1999/2000 | 14730 | 35560 | 5650 |
| 2000/2001 | 13630 | 31290 | 5110 |
| 2001/2002 | 10528 | 27213 | 3599 |
| 2002/2003 | 10117 | 27398 | 4139 |
| 2003/2004 | 9896 | 28188 | 5143 |
| 2004/2005 | 10490 | 23412 | 3028 |
| 2005/2006 | 7158 | 16851 | 1808 |
| 2006/2007 | 10465 | 21924 | 2581 |
| 2007/2008 | 15883 | 34360 | 4503 |
| 2008/2009 | 11838 | 27380 | 3051 |
| 2009/2010 | 11480 | 26210 | 3090 |
| 2010/2011 | 14040 | 31430 | 3110 |
| 2011/2012 | 11760 | 24350 | 3300 |
| 2012/2013 | 5830 | 14560 | 1730 |
| 2013/2014 | 7400 | 14620 | 1400 |
| 2014/2015 | 9180 | 20120 | 2040 |
| 2015/2016 | 4600 | 13200 | 1100 |
| 2016/2017 | 7700 | 16300 | 1300 |
| 2017/2018 | 9800 | 19700 | 1600 |
Contact
-
Terje Olav Rundtom
-
Trond Amund Steinset
-
Statistics Norway's Information Centre

