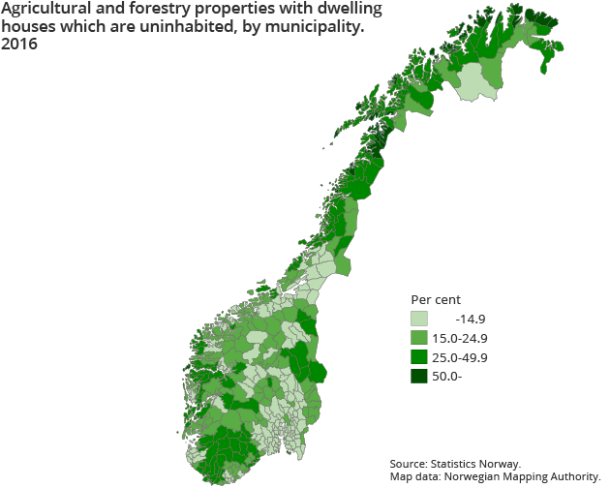
Most small farms depopulated
Published:
One in five agricultural and forestry properties with a dwelling were uninhabited in 2016. While 28 per cent of the properties with less than 5 hectares of agricultural land were depopulated, the corresponding figure for properties with more than 10 hectares was 5 per cent.
- Full set of figures
- Agricultural properties
- Series archive
- Agricultural properties (archive)
A total of 184 400 agricultural and forestry properties are registered, of which 147 500 have dwellings. In 2016, 30 000 of these properties with a dwelling were uninhabited. Some of these may, however, temporarily be used as holiday homes.
Agricultural land and depopulated properties
Small properties, where the agricultural land has been rented out to neighbours or is no longer in use, are most often depopulated. Out of 100 000 agricultural properties with 0.5-4.9 hectares of agricultural land, about 81 000 have one or more dwellings. In 2016, as much as 22 400 of these were depopulated. For 32 100 properties with more than 10 hectares of agricultural area, only 1 500 were depopulated.
7 per cent reside on an agricultural and forestry property
In 2016, 7 per cent of the inhabitants in Norway resided on an agricultural and forestry property. In the county of Sogn og Fjordane in the western part of Norway, one in five resided on an agricultural and forestry property, while the corresponding figure for the more central counties of Oslo and Akershus was less than 2 per cent.
Figure 2. Buildings on agricultural and forestry properties. 2016
| Dwelling houses | Agricultural buildings | Other type of buildings | |
| Uninhabited properties | 33336 | 80170 | 96804 |
| Inhabited properties | 175700 | 366711 | 211247 |
One million buildings
A total of one million buildings are situated on agricultural and forestry property, and almost half of these are buildings for agricultural purposes. Eighty per cent of the buildings are located on agricultural properties with residents. There are 33 300 dwellings situated on depopulated properties.
In total, 211 000 of the buildings were built before 1900 and are registered in the national register of old and protected buildings, SEFRAK. Almost 60 per cent of the buildings in this register are situated on agricultural and forestry properties.
Figure 3. The area of agricultural and forestry properties, by type of area and county. 2016
| Othert area | Unproductive forest | Productive forest | Agricultural area | |
| Finnmark Finnmárku | 72.1 | 25.8 | 1.8 | 0.3 |
| Troms Romsa | 63.9 | 20.0 | 14.2 | 1.9 |
| Nordland | 62.6 | 17.9 | 16.8 | 2.6 |
| Nord-Trøndelag | 51.6 | 13.1 | 31.1 | 4.3 |
| Sør-Trøndelag | 54.2 | 15.8 | 24.9 | 5.1 |
| Møre og Romsdal | 52.0 | 13.9 | 27.9 | 6.2 |
| Sogn og Fjordane | 39.1 | 16.4 | 36.4 | 8.1 |
| Hordaland | 47.9 | 12.7 | 33.2 | 6.2 |
| Rogaland | 54.0 | 12.2 | 19.5 | 14.3 |
| Vest-Agder | 40.3 | 14.1 | 41.9 | 3.7 |
| Aust-Agder | 27.9 | 18.0 | 52.1 | 2.0 |
| Telemark | 31.7 | 22.7 | 43.3 | 2.4 |
| Vestfold | 7.7 | 5.4 | 65.4 | 21.5 |
| Buskerud | 32.5 | 16.4 | 46.4 | 4.7 |
| Oppland | 51.3 | 12.9 | 30.7 | 5.0 |
| Hedmark | 26.3 | 15.0 | 53.9 | 4.8 |
| Akershus og Oslo | 8.1 | 2.7 | 71.6 | 17.6 |
| Østfold | 8.2 | 6.9 | 64.4 | 20.5 |
-
More tables and figures in the statistics agricultural properties
Contact
-
Trond Amund Steinset
-
Anne Snellingen Bye
-
Statistics Norway's Information Centre

