Content
Published:
This is an archived release.
NOK 141 000 in agricultural income
According to information from the tax assessment for personal taxpayers, the average entrepreneurial income from agriculture was NOK 141 000 per holding in 2002. However, one out of five holdings had no agricultural income or negative agricultural income. The average agricultural income for the person considered as holder of the holding was NOK 115 000.
Great variations in income from agriculture
The statistics cover agricultural holdings operated by natural persons, irrespective of the importance of the holding as a source of income. An essential feature of Norwegian agriculture is that many holdings are small and are operated on a part-time basis. The first part of this article looks at the holdings' entrepreneurial income from agriculture. This income consists of entrepreneurial income from agriculture for the holder and any spouse who takes part in the farm operation. The second part of the article looks at the holders' incomes, including income from other activities than agriculture.
Out of a total of almost 62 000 holdings in 2002, 60 000 were operated by natural persons. Such holdings had an average entrepreneurial income from agriculture of NOK 141 300. The average income increased by NOK 14 400 or 11 per cent from 2001 till 2002, compared with NOK 1 500 or 1.2 per cent from 2000 till 2001. Several factors influence agricultural income, such as the price of output and input commodities and the amount of subsidies, weather conditions and the structural development in the industry. From 2001 till 2002, the number of small holdings dropped significantly, and consequently a larger share of the production takes place on large and more efficiently operated holdings.
If we look at the type of farm, holdings with pigs and/or poultry had the highest average entrepreneurial income from agriculture with NOK 313 800, followed by holdings with mixed cattle with NOK 291 200. Holdings with sheep husbandry and holdings with cereal and oil seed production had the lowest average agricultural incomes with NOK 53 600 and NOK 62 800 respectively. The size of the production is the main reason for great variations in agricultural income by type of farming. Many sheep husbandry holdings are small, and cereal and oil seed production requires little labour input, but considerable machinery and equipment. Many holders and/or spouses of the latter type of holdings have other income-generating work, while for example milk production and pig rearing often require a lot more labour input and are difficult to combine with work off the holding.
In 2002, about 20 per cent of the holdings had no positive entrepreneurial income from agriculture. Of these holdings two out of three lost money in agriculture, while the remaining had no agricultural income. It is assumed that the latter are such small holdings that they are not considered as industry by the tax authorities. Almost 22 per cent of the holdings had NOK 250 000 or more in entrepreneurial income from agriculture in 2002.
Highest agricultural income in Rogaland
In 2002, holdings in Rogaland county had an average entrepreneurial income from agriculture of NOK 215 700. This is more than three times as much as in Telemark county, which is the county with the lowest average agricultural income. On average, holdings in Rogaland are larger and holdings with milk production or pigs/poultry are more frequent. The natural conditions for agriculture, which are quite good in Rogaland, may also influence the financial results.
The overall entrepreneurial income from agriculture for all holdings was NOK 8 500 million in 2002. Between 1999 and 2002, overall agricultural income has varied between NOK 8 200 million and 8 500 million, while the number of holdings operated by natural persons in this period fell by almost 10 000 or 14 per cent. Holdings in Rogaland county had an overall entrepreneurial income from agriculture of NOK 1 229 million. This amounts to 14.5 per cent of the total for the whole country. Rogaland was followed by Oppland county, at NOK 848 million.
Wages and salaries more important than income from agriculture
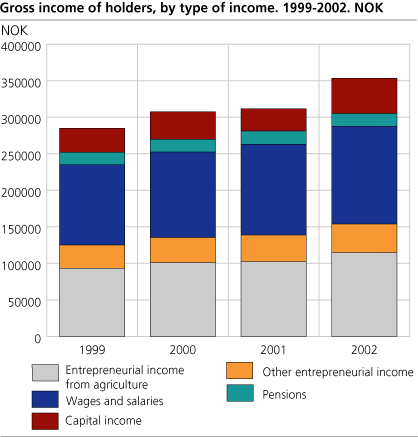
In 2002, the average gross income for holders was NOK 353 200. The average gross income consisted of 38 per cent wages and salaries, 32.5 per cent entrepreneurial income from agriculture, 11 per cent other entrepreneurial income, 5 per cent pensions and almost 14 per cent capital income. The entrepreneurial income from agriculture and other industries have been stable in the past years. From 2001 to 2002, the share of wages and salaries dropped, while income from property rose. The tax on received dividends was lifted in 2002. This caused a sharp increase in received dividend for Norwegian households.
In 2002, 35 per cent of the holders had entrepreneurial income from agriculture as the main source of income, while 15 per cent of the holders had less than 10 per cent of the total gross income from agriculture. These percentages have hardly changed in the years 1999 - 2002. During this period a significant number of small holdings has closed down. Accordingly, the figures indicate that holders of increasingly larger holdings supplement entrepreneurial income from agriculture with other income.
Agriculture main source of income on dairy cattle holdings
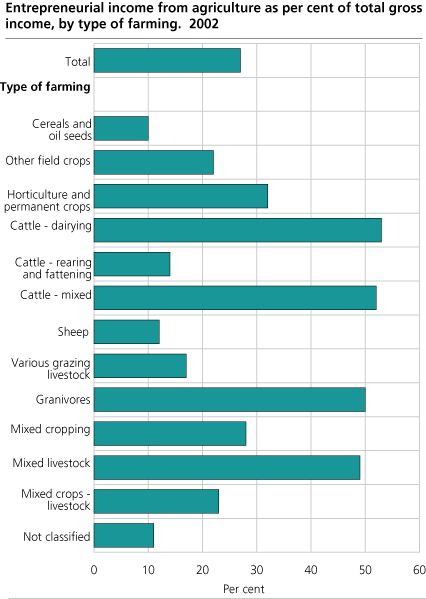
Entrepreneurial income from agriculture by farm type varies in the same way for holders as for holdings. On cereal and oil seed holdings, 60 per cent of the holders had less than 10 per cent of gross income from agriculture, while almost 9 per cent had entrepreneurial income from agriculture as the main source of income. The corresponding figures for holdings with sheep husbandry were 53 and 15 per cent. On average, holders operating holdings with sheep husbandry or cereal and oil seed production had more than 50 per cent of the gross income from wages and salaries. The situation for dairy cattle holdings is totally different; only 7 per cent of the holders had less than 10 per cent of their gross income from agriculture, while 74 per cent had entrepreneurial income from agriculture as the main source of income. Also within other animal husbandry farm types like pig/poultry, mixed cattle and mixed livestock more than half of the holders had agriculture as the main source of income.
The statistics cover more information from the tax assessment for personal taxpayers than included in this article, e.g. statistics on ordinary income, personal income, pensionable income and assessed taxes.
|
Holding is an enterprise with at least 0.5 ha utilized agricultural area or with livestock husbandry or horticulture exceeding certain thresholds. Holder is the person considered as responsible for operating the holding. Entrepreneurial income from agriculture is surplus according to the general trading statement for agriculture, included entrepreneurial social security benefits in agriculture, forestry and fishery. Deductions like union subscriptions, entrepreneurial deficit, interest on debt and a separate agricultural deduction are not deducted. Gross income is total wages and salaries, pensions, entrepreneurial income and other income, mainly property income, before any deduction. |
Tables:
- Table 1 Entrepreneurial income from agriculture, by county, agricultural area in use and age of holder. Refer to holders and spouses/cohabitants
- Table 2 Entrepreneurial income from agriculture, by type of farming. Refer to holders and spouses/cohabitants. 2002
- Table 3 Agricultural deduction, interest paid and debt, by county, agricultural area in use and age of holder. Refer to holders and spouses/cohabitants
- Table 4 Agricultural deduction, interest paid and debt, by type of farming. Refer to holders and spouses/cohabitants. 2002
- Table 5 Total gross property, tax value of agricultural real estate and net property, by county, agricultural area in use and age of holder. Refer to holders and spouses/cohabitants
- Table 6 Total gross property, tax value of agricultural real estate and net property, by type of farming. Refer to holders and spouses/cohabitants. 2002
- Table 7 |Average gross income for holders, by county, agricultural area in use and age of holder. NOK
- Table 8 |Average gross income for holders, by type of farming. 2002. NOK
- Table 9 Holders by entrepreneurial income from agriculture as per cent of gross income, by county, agricultural area in use and age of holder
- Table 10 Holders by entrepreneurial income from agriculture as per cent of gross income, by type of farming. 2002
Contact
-
Per Amund Aarstad
E-mail: per.amund.aarstad@ssb.no
tel.: (+47) 40 81 13 79
-
Berit Bjørlo
E-mail: berit.bjorlo@ssb.no
tel.: (+47) 40 81 13 76


