Content
Published:
This is an archived release.
Record year for Norwegian salmon
Preliminary figures show 2009 to be a very good year for reared salmon. The first hand value increased by 30 per cent, and sales amounted to 17 per cent. The average sales price was also higher compared to the previous year.
The total first hand value for Norwegian aquaculture amounted to NOK 22 billion, with a quantity of almost a million tonne.
The first hand value of salmon was historically high and reached almost NOK 20 billion, which is NOK 4.6 billion more than in 2008. The average sales price rose by 12 per cent and amounted to NOK 23.05 per kilo.
After the peak year of 2008, the amount of reared trout had a slight decrease in 2009. Preliminary figures for 2009 showed an 11 per cent fall in sales, but the sales value was still 4 per cent higher than in 2008. The total first hand value was NOK 1.7 billion in 2009.
The considerable growth in both volume and value can be explained by the collapse of the aquaculture industry in Chile. Production stopped after an outbreak of infectious salmon anaemia, and several Chilean markets were subsequently supplied by Norwegian fish.
Lower cod prices
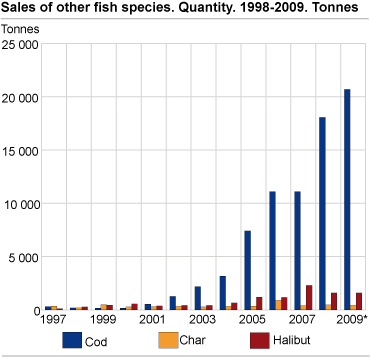
The sales quantity of cod increased by 15 per cent, but the value fell by 4 per cent. Due to low cod prices in fishery in 2009, the price per kilo dropped by 16 per cent for reared cod.
Lower sales of other species
For other species like halibut and char, the 2009 figures showed a reduction in sales, but the average prices per kilo increased. Overall, the aquaculture of non salmonid fish experienced a 2 per cent decline in volume, and a corresponding fall in first hand value by almost 13 per cent.
Employment still up
The high production also effected employment, and the number of employees in fish farms increased by almost 5 per cent. The same trend was found in hatcheries and fingerling production, with slightly more than an 8 per cent rise in employment. In total, 4 148 persons were employed in salmon and trout production.
Loss
For 2009, the magnitude of loss was almost the same as in 2008. Trout had the lowest loss with 6.7 per cent.
Downward trend for shellfish
The shellfish industry fell further in 2009, with a fall in first hand value of 37 per cent1, and a reduction in quantity by 16 per cent. Since 2005 there has been a downward trend, which continues due to the latest figures.
Tables:
- Table 1 Sales of slaughtered fish for food. Quantity, by fish species and county. 2009*. Tonnes
- Table 2 Sales of slaughtered fish for food. First hand value, by fish species and county. 2009*. NOK 1 000
- Table 3 Number of licenses running, workers and labour input, by type of production and county. Salmon and rainbow trout. 2009*
- Table 4 Stock of live fish for food, by species of fish and county. All fish species. 2009*. 1 000 pieces
- Table 5 Sales of shellfish, by fish species. 2000-2009*. Tonnes and NOK 1 000
Contact
-
Statistics Norway's Information Centre
E-mail: informasjon@ssb.no
tel.: (+47) 21 09 46 42


