Content
Published:
This is an archived release.
NOK 650 million in gross income from outfield activities
In 2003 the forest owners had a total gross income of NOK 650 million from supplementary industries that utilised the properties' outfield resources. As a comparison, the aggregated gross value of industrial roundwood sold in 2003 totalled NOK 2 billion.
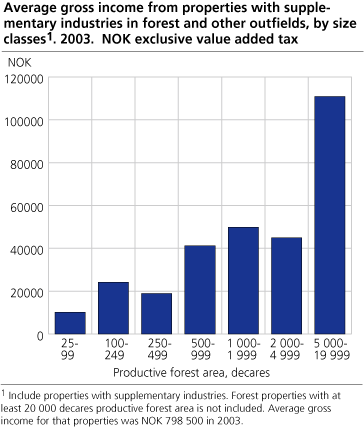
This is the first time Statistics Norway presents figures on gross income from outfield activities. The figures show that 12 per cent of the forest properties had some kind of supplementary industry using the areas and resources in forest and other outfields in 2003. Three in five properties with a forest area between 5000 and 19999 decares had supplementary industry in 2003, while nine in ten forest properties with at least 20 000 decares productive forest area had these industries.
. In average, the gross income was NOK 45 000 per property with supplementary industry in 2003.On properties with a productive forest area between 5000 and 19 999 decares, the average gross income from supplementary industries was estimated to NOK 111 000 in 2003. Properties with at least 20 000 decares productive forest area, had an average gross income calculated to NOK 799 000.
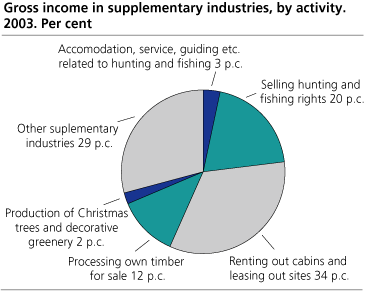
The labour input in the supplementary industries made up 1.3 million man-hours - 705 man-years - in 2003. 777 000 man-hours were carried out by the forest owners themselves. In total 325 000 man-hours were performed on accommodation, service, guiding etc. related to hunting and fishing activities and on sale of hunting and fishing rights.
Forest owners performed 2 000 man-years in forestry
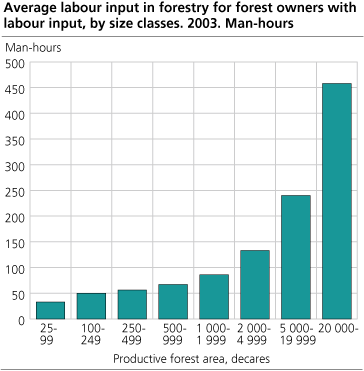
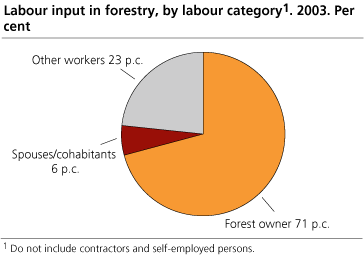
The forest owners' labour input in forestry was 3.8 million man-hours - 2 068 man-years - in 2003. More than half of the owners spent some time on administration and practical work. Average working time was 53 man-hours. In 2003, the total labour input in forestry was 5.4 million man-hours - 2 917 man-years, included labour input by spouses/cohabitants and hired help but excluded work done by contractors and self-employed persons. The latter categories are now doing almost 90 per cent of the cutting and hauling.
Decline in planting
Planting and sowing was done on 8 per cent of the forest properties in 2003. In 1999, the corresponding figure was 11 per cent. In 2003, 201 000 decares were planted, while clear felling took place on 287 000 decares. An average of 21 decares was planted per property where planting took place. In 1999 planting and sowing was carried out on 265 000 decares. Governmental subsidies to planting and sowing came to an end in 2003 and may explain some of the decrease.
Compared to statistics on silviculture for 2003, which is based on transactions in the Forest Trust Fund, the planted area from this survey is larger. The main reason is that not all planting is financed by the Forest Trust Fund.
Less tending of young trees
Young forest tending was done on 13 per cent of the properties in 2003. In 1999, this kind of work was done on 17 per cent of the properties. Stop of governmental subsidies to activities like young forest tending may explain some of the decline. An average of 21 decares were tended per property in 2003. In 1999 the corresponding figure was 28 decares. The total tended area has decreased significantly, and amounted to 322 000 decares in 2003, while the tended area was 557 000 decares in 1999. About 40 per cent of the work was financed by the Forest Trust Fund in 2003.
Two in five forest owners also farmed
Since 1999 the proportion of forest properties with agricultural area in use has dropped from 44 to 38 per cent. In 2003 the number of combined farmer-forest owners is approximately 45 500.
| Forest properties with agricultural area in use1. 2003 |
| 1979 | 1989 | 1999 | 2003 | ||||||||||||||||||||||||||||||||||||
|---|---|---|---|---|---|---|---|---|---|---|---|---|---|---|---|---|---|---|---|---|---|---|---|---|---|---|---|---|---|---|---|---|---|---|---|---|---|---|---|
| Forest properties, total | 120 930 | 125 522 | 120 471 | 118 617 | |||||||||||||||||||||||||||||||||||
| Forest properties with agricultural area in use. Per cent | 62 | 53 | 44 | 38 | |||||||||||||||||||||||||||||||||||
| 1 | Includes properties with at least 25 decares productive forest area. |
You can find more results from the Sample Survey of Forestry 2004 in the article Three quarters of forest area profitable
Tables:
- Table 1 Gross income for 2003 in suplementary industries that utilise the properties' area and resources in forest and other outfields. NOK 1 000 exclusive value added tax
- Table 2 Labour input in supplementary industries that utilised the properties' area and resources in forest and other outfields, by county, productive forest area and labour category. 2003. Hours
- Table 3 Labour input, by county and size of productive forest area. 2003. Man-hours
- Table 4 Forest area planted or seeded by county and productive forest area. 2003
- Table 5 Forest area with young forest tended, by county and size of productive forest area. 2003
Contact
-
Statistics Norway's Information Centre
E-mail: informasjon@ssb.no
tel.: (+47) 21 09 46 42


