Content
Published:
This is an archived release.
Increasing grain area
The total grain area amounted to 2.89 million decares in 2016, an increase of 24 400 decares from the year before.
| 2016 | Per cent | ||
|---|---|---|---|
| 2015 - 2016 | 2006 - 2016 | ||
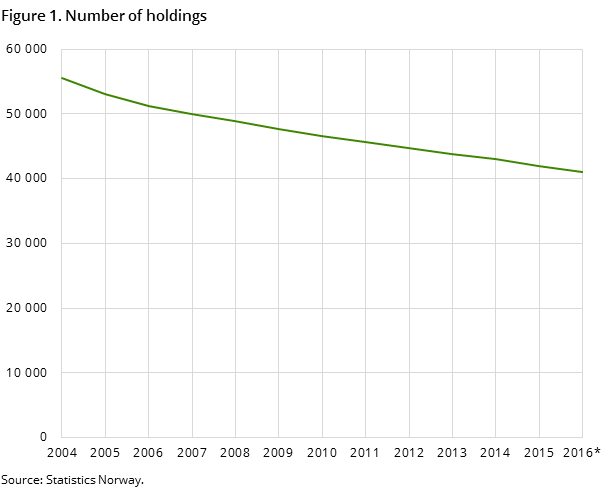
| Number of holdings, total | 41 064 | -2.3 | -19.8 |
| Natural person | 38 976 | -2.0 | -19.5 |
| Legal person | 2 088 | -7.2 | -25.5 |
| Agricultural area in use. Decares | 9 824 526 | -0.4 | -5.0 |
| Fully cultivated land, decares | 8 071 995 | -0.4 | -6.4 |
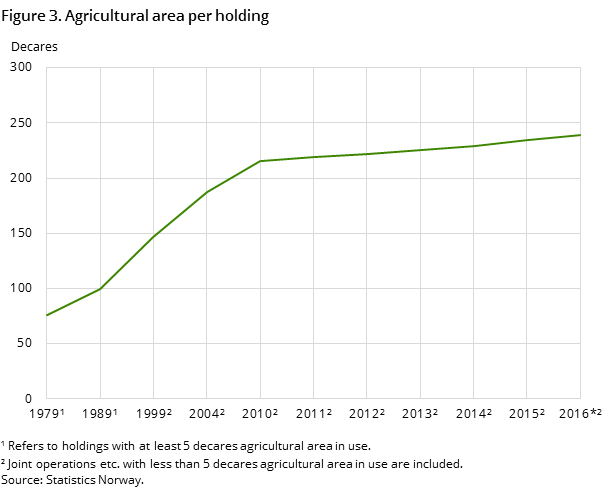
| Agricultural area per holding. Decares | 239.2 | 1.9 | 18.4 |
| Holdings keeping domestic animals of various kinds | |||
| Cow | 12 809 | -1.3 | -32.5 |
| Sheep 1 year and over | 14 636 | 1.3 | -11.5 |
| Pigs, total | 2 273 | 0.6 | -27.8 |
| Hens | 2 058 | -0.4 | -2.0 |
| Holdings cultivating various crops | |||
| Grain and oil seeds | 11 173 | -0.8 | -29.4 |
| Potato | 1 875 | -4.0 | -55.4 |
| Meadows for mowing and pastures | 32 257 | -2.4 | -18.1 |


Barley accounted for 43 per cent of the total grain area, while oats and wheat accounted for 26 and 22 per cent respectively. From 2015, the area of barley increased by 138 900 decares to a total of 1.37 million decares in 2016, and the area of oats by 127 200 decares to 759 700 decares. In the same period, the area of wheat decreased by 189 700 decares to a total of 667 900, and the area of rye by 58 700 decares to 45 500 decares.
Fewer holdings
The number of holdings dropped by 2.3 per cent from 2015 to 2016 to a total of 41 100. In 2016, 39 000 holdings were operated by natural persons, while 2 100 were operated by various legal persons, e.g. joint operations, limited companies and institutions. Since 1999, the number of holdings being operated by a legal person increased from 1.1 per cent to 5.1 per cent of all holdings.
The total utilised agricultural area dropped by 31 000 decares to 9.84 million decares in 2016. Of the total agricultural area in 2016, fully cultivated agricultural land covered 8.07 million decares, 0.2 million decares were surface cultivated meadows and 1.56 million decares infield pastures. The average size of farms increased from 235 decares in 2015 to 239 decares in 2016.
More cattle and sheep, fewer pigs
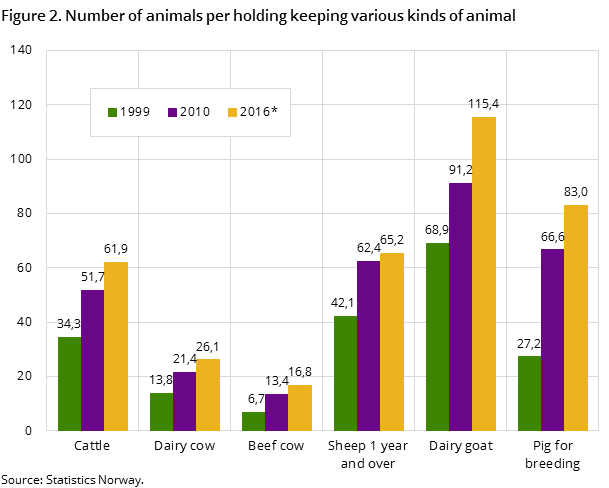
The number of cattle increased slightly by 18 100 from 2015 to 2016 to a total of 871 500. The number of beef cows increased, while the number of dairy cows was slightly reduced. The average herd size for dairy cows was 26, and for beef cows 16.
The number of sheep aged one year and older increased by 35 900 from 2015 to 2016.
The number of breeding pigs dropped by 2 800 to a total of 93 000 in 2016. The average herd of breeding pigs amounted to 83 in 2016.
Additional information
Agricultural holdings on grids (1km, 5km)
Contact
-
Berit Bjørlo
E-mail: berit.bjorlo@ssb.no
tel.: (+47) 40 81 13 76
