Content
Published:
This is an archived release.
Health expenditure a stable share of GDP
Preliminary results estimate total health expenditure of NOK 270 billion in 2012, corresponding to approximately NOK 54 000 per capita. Measured as a share of GDP, total health expenditure amounted to 9.4 per cent. This share has remained relatively unchanged in the last three years.
| 2008 | 2009 | 2010 | 2011 | 2012 | |
|---|---|---|---|---|---|
| 1Estimates for 2011 and 2012 are preliminary | |||||
| Total health expenditure. NOK million | 218 906 | 230 473 | 239 730 | 255 297 | 273 233 |
| Volume growth from previous year | 2.2 | 1.4 | 1.1 | 1.2 | 2.1 |
| Capital formation in health care institutions. NOK million | 11 362 | 10 105 | 8 945 | 9 484 | 10 579 |
| Current expenditure on health. NOK million | 207 544 | 220 368 | 230 785 | 245 813 | 262 653 |
| Total health expenditure. Per cent of GDP | 8.6 | 9.7 | 9.4 | 9.3 | 9.4 |
| Total health expenditure. Per cent of GDP Mainland Norway | 11.8 | 12.3 | 12.1 | 12.2 | 12.4 |
| Total health expenditure per inhabitant. NOK | 45 909 | 47 730 | 49 032 | 51 543 | 54 444 |
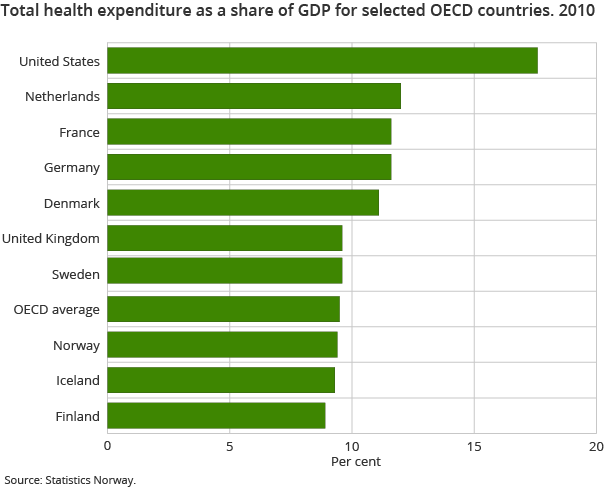
Measured as a share of GDP, total health expenditure in Norway was just below the OECD average, which is 9.5 per cent. The last available OECD figures are for 2010. These figures show that the health expenditure shares in Iceland and Finland were somewhat lower than in Norway, while Sweden and Denmark had shares of 9.6 and 11.1 per cent respectively. No other country was close to spending as much on health as the USA; with 17.6 per cent of GDP they were ahead of the Netherlands by 5.6 percentage points. France and Germany had the next largest shares. Preliminary results for Norway showed that our share of GDP has been relatively stable at 9.4 per cent in the last few years.
Compositional changes in expenditure by function
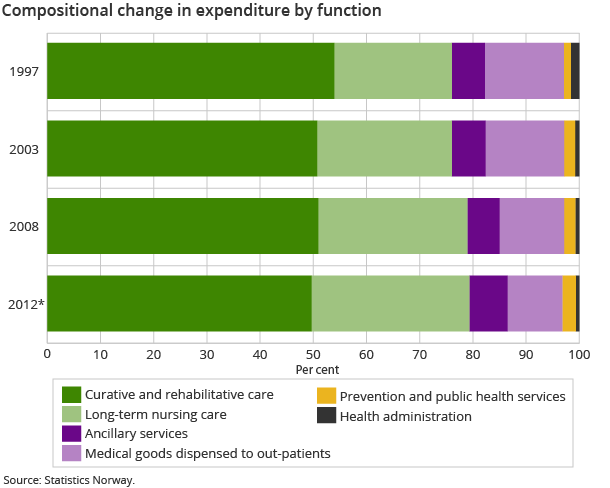
Spending on services of curative and rehabilitative care amounted to just below 48 per cent of total health expenditure in 2012. This share has changed little in the last decade. Medical goods dispensed to out-patients accounted for approximately 10 per cent in 2012, down four percentage points compared to 2003. Generic drugs and the step price model have contributed to relatively lower growth in expenditure on pharmaceuticals compared to other health expenditure, which may help explain why its share has fallen.
By comparison, expenditure on services of long-term nursing care increased by four percentage points, to 29 per cent in 2012. This is related to an increase in the number of persons receiving nursing care. Among long-term residents in nursing facilities, there has been an increase in the share of residents with extensive need for care and help. In addition, the number of persons aged 67 years or younger, receiving nursing care at home, has increased. This group also receives far more help than the age group of 67 years or more.
There has also been an increase in the share spent on preventive care. One reason is better data availability for some of these expenditures. Another is that towards the end of 2009 and the beginning of 2010, The Norwegian Institute of Public Health purchased large amounts of vaccines against the pandemic flu. As a share of total health expenditure, spending on preventive care in 2012 accounted for 2.5 per cent in 2012.
Ancillary services, which consist of clinical laboratory and diagnostic imaging, as well as patient transportation and emergency rescue, accounted for approximately 7 per cent of total health expenditure in 2012. Compared to the period 1997 to 2009, the share for ancillary services increased by one percentage point in 2010, and has remained at this level.
After a period of decline following the completion of several large hospitals, investments increased again from 2010. The increase is partly due to the building of a new hospital in Østfold.
Little change in financing responsibility
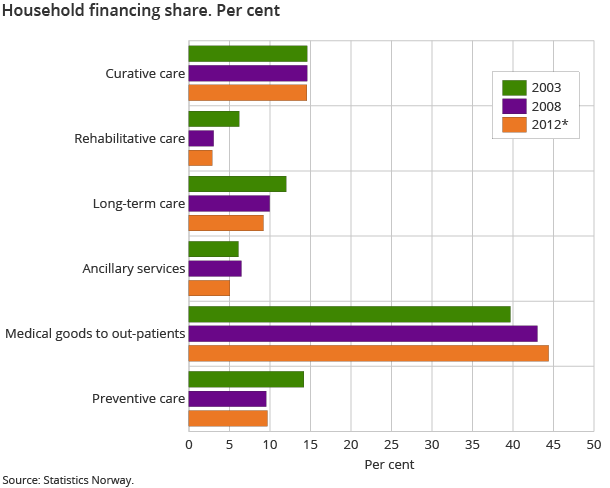
Public financing has remained stable at around 85 per cent of total health expenditure for the last five years. This share, however, varies between the different functions of health care. General government covered 85 per cent of expenditure on curative care, with little change over the years. The corresponding share for the second largest area of spending; long-term nursing care, was 90 per cent in 2012, and has increased somewhat in the last few years. Home nursing care is exempt from co-payment. For in-patient long-term nursing care in isolation, general government financed approximately 86 per cent.
General government increased its financing share of rehabilitative care and laboratory and diagnostic imaging in 2012 to 97 and 92 per cent respectively; an increase of three percentage points compared to 2003. These are both, however, relatively small areas of expenditure.
Private household out-of-pocket expenditure accounted for slightly less than 45 per cent of total expenditure on medical goods dispensed to out-patients. This share has had a slight increase in the last five years, with a larger increase over the last decade. The increase was mainly for medical durables, whereas the financing share for pharmaceuticals has remained unchanged. One explanation may be a higher entry of generic drugs, which is likely to have contributed to slower price growth on pharmaceuticals.
Public health expenditure increases more than public expenditure
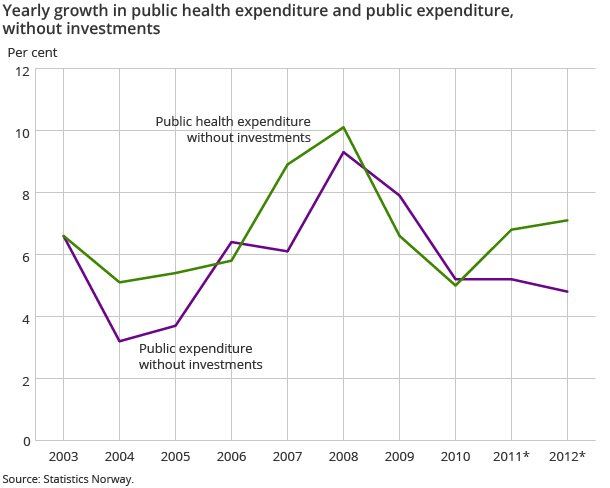
Preliminary estimates indicated that public health expenditure accounted for 18.5 per cent of total public expenditure in 2012. In 2003, the corresponding share was 17.6 per cent. Excluding investments, which tend to vary more than current expenditure, health spending increased by 1.5 percentage points, to 18.2 per cent in 2012. The average yearly growth rate in this period was approximately 6.7 per cent for public health expenditure; one percentage point higher than the average yearly growth in public expenditure. Investments were also excluded here.
Contact
-
Eirik Larsen Lindstrøm
E-mail: eirik.lindstrom@ssb.no
tel.: (+47) 46 78 22 92


