Content
Published:
This is an archived release.
Health expenditure represents 10 per cent of GDP
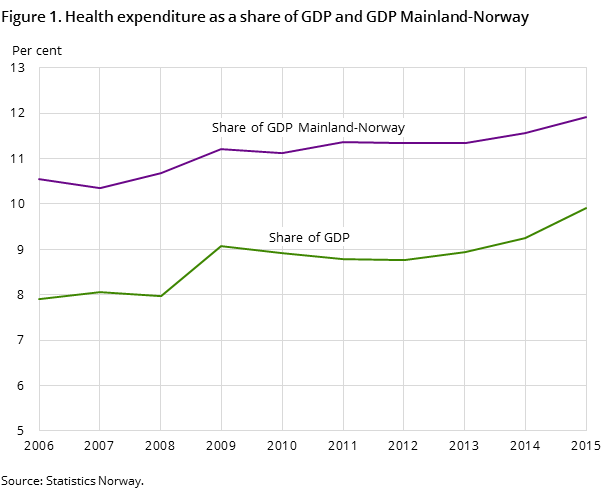
Preliminary figures show that we spent NOK 311 billion on health in 2015. This represents nearly 10 per cent of GDP, and amounts to about NOK 60 000 per capita.
| 2012 | 2013 | 2014 | 2015 | |
|---|---|---|---|---|
| 1Figures for the last two years are preliminary. | ||||
| 2Current health expenditure does not include capital formation | ||||
| Current expenditure on health | 260 182 | 274 246 | 291 925 | 311 094 |
| Volume growth from previous year | 0.9 | 2.4 | 2.1 | |
| Capital formation in health care institutions. NOK million | 14 458 | 18 487 | 20 572 | 18 433 |
| Current expenditure on health. Per cent of GDP | 8.8 | 8.9 | 9.3 | 9.9 |
| Current expenditure on health. Per cent of GDP Mainland Norway | 11.3 | 11.3 | 11.6 | 11.9 |
| Current health expenditure per capita | 51 844 | 53 984 | 56 823 | 59 942 |


Preliminary figures from the health accounts show that spending on health amounted to NOK 311 billion in 2015. Adjusted for inflation, health spending grew 2.1 per cent from 2014 to 2015. Health expenditure per capita also rose from 2014 to 2015. The volume of health expenditures per capita rose 1.1 per cent in the same period.
Health spending as a share of GDP almost 10 per cent in 2015
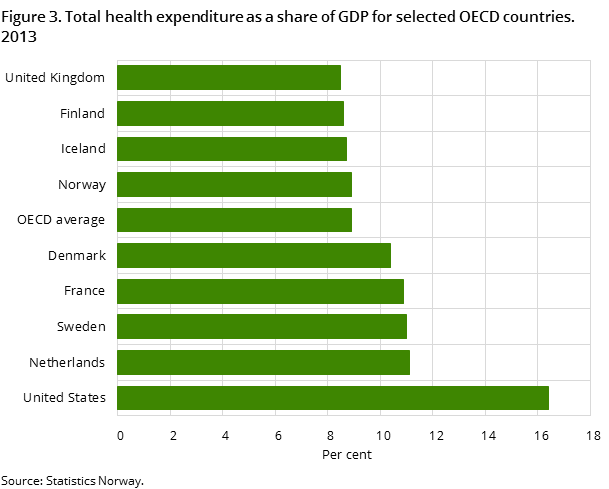
Health expenditure as a share of GDP is often used in international comparisons of health spending. This may shed light on how much of the available resources are devoted to health. The latest figures from the OECD show that health spending accounted for an average of 8.9 per cent of GDP in the OECD countries in 2013. Norway's share was at the OECD average in 2013.
In 2014 and 2015, health spending as a share of GDP rose to 9.3 per cent and 9.9 per cent respectively. An important factor behind the increase is the sharp fall in oil prices, particularly in 2015. This decline has led to a slump in GDP in 2015 relative to the year before. As health spending shows a more stable increase, health spending as a share of GDP will also increase.
To remove the effect of fluctuations in oil and gas prices, we often look at health spending as a share of GDP for mainland Norway. This share has also increased from 2014 to 2015, but more modestly. The share increased from 11.6 per cent in 2014 to 11.9 per cent in 2015. The increase in this share should be seen in context of the developments in the rest of the economy, including in industries supplying the petroleum industry, which have been hit hard by the decline in investment activity.
The government covers 85 per cent of health spending
In 2015, we spent about NOK 60 000 per capita on health. Of this, more than NOK 51 000 was paid by the government. The remainder, just under NOK 9 000, was paid by the households themselves. The share of public funding is relatively stable, and in recent years has been about 85 per cent.
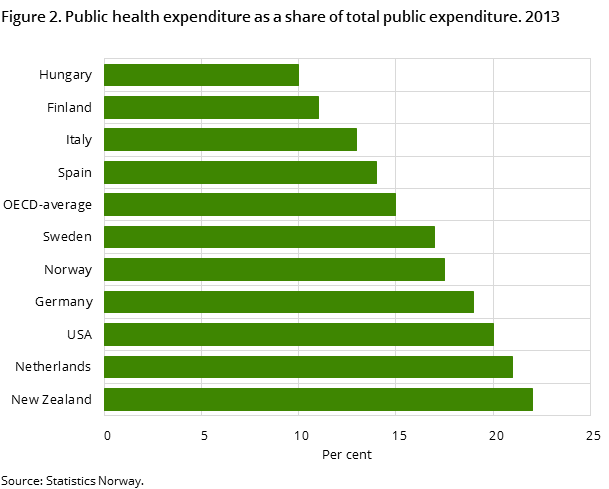
Health expenditure accounts for a significant portion of government expenditure, and in 2013 this share was 17.5 per cent. In the OECD, the share varies between 10 per cent in Hungary and 22 per cent in New Zealand, with an average of 15 per cent. Compared to the rest of the OECD countries, Norway thus spends a slightly larger share of its public budget on health.
Curative and rehabilitative care account for 50 per cent of total health spending
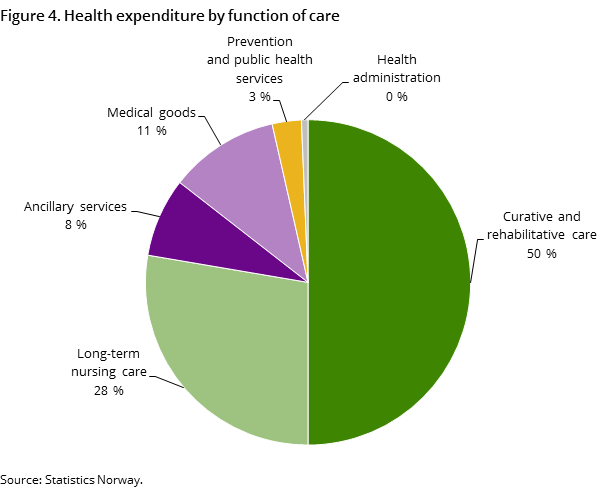
Curative and rehabilitative care account for the largest share of the current health expenditure, and accounted for 50 per cent of health spending in 2015. Curative and rehabilitative care includes hospital services, physician visits, dental visits and physiotherapy etc.
Find comparable data on health expenditure in OECD countries in Health at a glance (2015).
Health related long-term care also constitutes a large proportion of health spending, with 28 per cent in 2015. This percentage is relatively high compared to other OECD countries. In the OECD, the average was 12 per cent in 2013, but some countries have a share as low as 1 per cent. By comparison, health spending related to long-term care services in Sweden, Denmark and the Netherlands ranged between 24 and 26 per cent in 2013.
Total long-term care services of NOK 97 billion
For the first time, the health accounts provide a complete picture of the costs of long-term care services. Previously, the health accounts covered only the part of long-term care expenditure that is considered health-related. In order to obtain a more complete picture of the total long-term care expenditure, we also show the part of long-term care expenditure that is not considered health-related.
Total expenditure on long-term care amounted to NOK 97 billion in 2015. Of this, NOK 79 billion is considered health-related and is included in health expenditure figures. The remaining NOK 18 billion, which relates to social care services to assist with instrumental activities of daily living, is not considered health-related.
Decrease in investments
After several years of increasing investment for health purposes, there is a reduction in investments from 2014 to 2015. During this period, the volume of investments decreased about 13 per cent. This must be seen in light of the completion of a new hospital in Oslo, which has generated a high level of investment in recent years. Investments amounted to about NOK 18 billion in 2015. Of this, just over NOK 4 billion was investment in research and development.
Volume growth in national figures differs from OECD estimateOpen and readClose
The volume growth in our national figures may differ from the growth estimated by the OECD in the publication “Health at a Glance”. This is because the OECD uses a method where the total health spending figures are deflated using an economy-wide GDP deflator. In the Norwegian figures, the volume growth is calculated according to the national accounts method, meaning that many different but relevant price indices are used or that the volume changes are observed directly. An example of the latter is the hospitals’ DRG system, which can have information on the volume of hospital services.
Contact
-
Eirik Larsen Lindstrøm
E-mail: eirik.lindstrom@ssb.no
tel.: (+47) 46 78 22 92
