Content
Published:
This is an archived release.
Lower disposable income for households
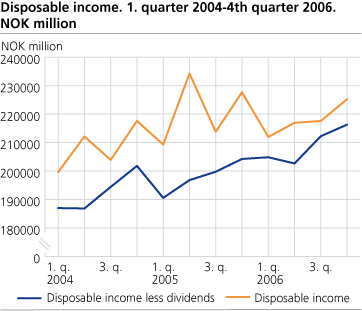
The real disposable income of the households sector 1 fell by 3.5 per cent from 2005 to 2006. The household saving ratio in 2006 was down to 1.4 per cent. Saving ratios for the last two quarters of 2006 were negative.
According to the estimates of national accounts, disposable income for the households sector fell by 1.5 per cent. If one takes into account the price increase for consumption in households and non-profit institutions serving households, this constitutes a fall by 3.5 percent in real terms.
Value of dividends affects disposable income and saving ratio
Decrease in the disposable income of the households is mostly due to the lower dividend incomes in 2006, compared to 2005. According to the national accounts estimates for 2006, households received approximately NOK 55 to 60 billion less dividend payments than the previous year, probably related to the new tax regulations in Norway. From 2006 onwards, dividend incomes above a risk-free rate of return became subject to taxes as ordinary income. Until 2006, incomes from the dividends were exempted of taxes.
Since the developments in incomes are influenced by the dividend incomes, National Accounts Unit releases a data series that show the disposable income without the dividend payments. The disposable income less dividends went up by 5.6 per cent from 2005 to 2006, while the disposable real income without dividends showed a 3.5 percent increase.
Compensation of employees went up by 7.8 per cent from 2005 to 2006, according to the national accounts estimates. Property income received less dividends went up by 7.8 per cent. Property income paid on the other hand went up by 14.5 percent due to the increase in the debts and higher interests. This pulled the disposable income downwards.
Negative saving ratio in the fourth quarter
Saving ratio for households and non-profit institutions serving households is estimated at 1.4 per cent in 2006, while it was -1.3 per cent in the fourth quarter.
For further information on annual figures : Economic Survey 1/2007
Revisions
National accounts have recently revised its estimates. The quarterly figures for sector accounts are revised back to 2004. Quarterly figures back to 2002 will soon be available on the web.
(1)This sector includes households and non-profit institutions serving households.
| Disposable income for households and NPISHs. Current prices. NOK million |
| 2005 | 2006 | 1. quarter 2005 | 2. quarter 2005 | 3. quarter 2005 | 4. quarter 2005 | 1. quarter 2006 | 2. quarter 2006 | 3. quarter 2006 | 4. quarter 2006 | ||||||||||||||||||||||||||||||
|---|---|---|---|---|---|---|---|---|---|---|---|---|---|---|---|---|---|---|---|---|---|---|---|---|---|---|---|---|---|---|---|---|---|---|---|---|---|---|---|
| Disposable income | 885 055 | 871 750 | 209 305 | 234 279 | 213 806 | 227 665 | 211 980 | 216 951 | 217 588 | 225 231 | |||||||||||||||||||||||||||||
| Disposable income excluding dividends | 791 358 | 836 028 | 190 565 | 196 800 | 199 751 | 204 241 | 204 835 | 202 663 | 212 229 | 216 300 | |||||||||||||||||||||||||||||
Additional information
Contact
-
Pål Sletten
E-mail: pal.sletten@ssb.no
tel.: (+47) 99 29 06 84
-
Nils Amdal
E-mail: nils.amdal@ssb.no
tel.: (+47) 91 14 91 46

