Content
Published:
This is an archived release.
Rise in real disposable income for households
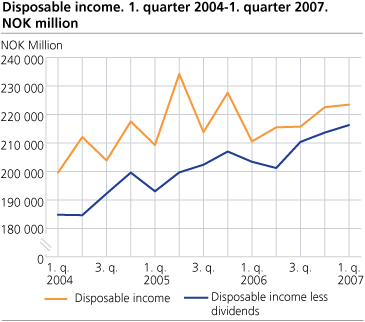
The real disposable income of the household sector1 was more than 5 per cent higher in the first quarter of 2007 than in the same period of 2006. The increase was 1.5 per cent compared to the fourth quarter of 2006. The household saving ratio was estimated to be 5.6 per cent in the first quarter of 2007.
According to the estimates of the national accounts, compensation of employees rose by 9 per cent from the first quarter of 2006 to the first quarter of 2007. We have currently little information on due dividends for 2007, however the preliminary estimates show that the amount will be around the same level as last year.
Since the development in income is influenced by dividend income, the Division for National Accounts releases an additional data series which shows the disposable income without dividend payments.
Positive saving ratio in the first quarter
The saving ratio for households and non-profit institutions serving households was 5.6 per cent in the first quarter of 2007, while it was negative for the last two quarters.
Revisions of 2006
Quarterly institutional sector accounts are based on preliminary calculations, and the greatest uncertainty is associated with the last quarter. New information is integrated in the figures continuously.
New information has resulted in a revision of the figures for compensation of employees for 2006, resulting in the saving ratio for 2006 being revised to 1.3 per cent.
| Disposable income for households and NPISHs. Current prices. NOK million |
| 2005 | 2006 | 1. quarter 2005 | 2. quarter 2005 | 3. quarter 2005 | 4. quarter 2005 | 1. quarter 2006 | 2. quarter 2006 | 3. quarter 2006 | 4. quarter 2006 | 1. quarter 2007 | |||||||||||||||||||||||||||||
|---|---|---|---|---|---|---|---|---|---|---|---|---|---|---|---|---|---|---|---|---|---|---|---|---|---|---|---|---|---|---|---|---|---|---|---|---|---|---|---|
| Disposable income | 885 016 | 864 351 | 2209 277 | 234 258 | 213 799 | 227 682 | 210 542 | 215 492 | 215 741 | 222 577 | 223 485 | ||||||||||||||||||||||||||||
| Disposable income excluding dividends | 802 063 | 828 629 | 193 029 | 199 670 | 202 365 | 207 000 | 203 398 | 201 203 | 210 382 | 213 646 | 216 289 | ||||||||||||||||||||||||||||
Tables
Additional information
Contact
-
Pål Sletten
E-mail: pal.sletten@ssb.no
tel.: (+47) 99 29 06 84
-
Nils Amdal
E-mail: nils.amdal@ssb.no
tel.: (+47) 91 14 91 46

