Content
Published:
This is an archived release.
Positive saving ratio for households
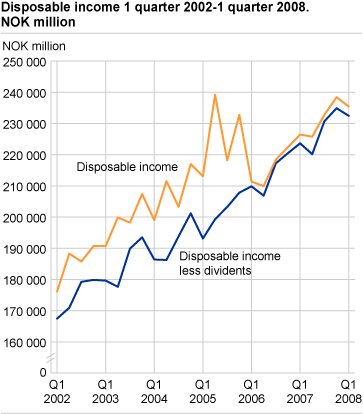
The disposable income of households less dividends was about 4 per cent or NOK 8.8 billion higher in the first quarter of 2008 than in the corresponding quarter of 2007. The increase in compensation of employees after tax contributed to this development together with a moderate increase in pensions and social support.
Households’ total income from wages and salaries less taxes was NOK 8.6 billion higher than in the first quarter of 2007. Pensions and social welfare assistance from the state sector rose by approximately NOK3.5 billion. This was mainly due to an increase in pensions and disability benefits.
Interest expenses for the households have increased sharply lately and were NOK 8 billion higher in the first quarter of 2008 than in the first quarter of 2007.
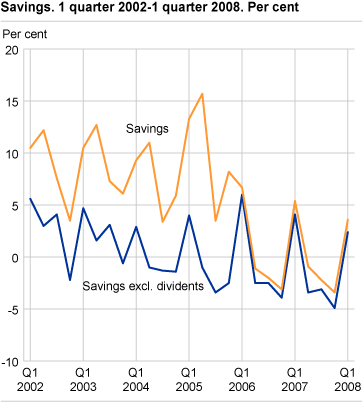
Savings, which is defined here as disposable income minus final consumption expenditure, amounted to NOK 8.6 billions in the first quarter of 2008. This is lower than in the corresponding quarter of 2007.
Revised savings figures for 2007
Due to new information on wages, salaries and interest expenses, the figures for household disposable income and savings have been adjusted for 2007. In spite of an upward adjustment of NOK 8.1 billion, the savings rate is still negative. According to preliminary estimates the savings rate is now -0.4 per cent for 2007.
For further information, see National accounts, institutional sector accounts .
| 2006 | 2007 | 1st quarter 2006 | 2nd quarter 2006 | 3rd quarter 2006 | 4th quarter 2006 | 1st quarter 2007 | 2nd quarter 2007 | 3rd quarter 2007 | 4th quarter 2007 | 1st quarter 2008 | |||||||||||||||||||||||||||||
|---|---|---|---|---|---|---|---|---|---|---|---|---|---|---|---|---|---|---|---|---|---|---|---|---|---|---|---|---|---|---|---|---|---|---|---|---|---|---|---|
| Disposable income | 862 116 | 923 459 | 211 388 | 209 938 | 218 379 | 222 412 | 226 451 | 225 780 | 232 810 | 238 418 | 235 460 | ||||||||||||||||||||||||||||
| Disposable income excluding dividends | 854 478 | 909 423 | 209 861 | 206 882 | 217 233 | 220 501 | 223 644 | 220 166 | 230 704 | 234 909 | 232 479 | ||||||||||||||||||||||||||||
RevisionsQuarterly institutional sector accounts are based on preliminary calculations. The uncertainty is greater in the last quarter of the year. New information is continuously integrated in the figures, which means that the previously released data might be revised. Quarterly institutional sector accounts are consolidated against the data from the quarterly national accounts data as well. |
Tables
Additional information
Contact
-
Pål Sletten
E-mail: pal.sletten@ssb.no
tel.: (+47) 99 29 06 84
-
Nils Amdal
E-mail: nils.amdal@ssb.no
tel.: (+47) 91 14 91 46


