Content
Published:
This is an archived release.
Higher disposable income
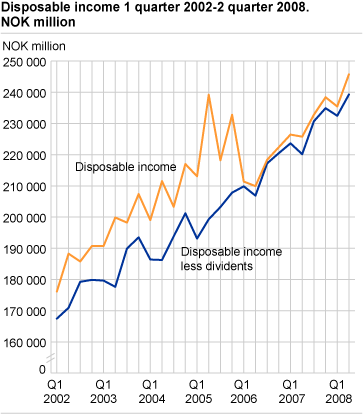
The disposable income of households less dividends went up by 8.7 per cent from 2nd quarter of 2007 to 2nd quarter of 2008 due to an increase in wages and salaries, pensions and social contributions from the government.
Households’ and non-profit institutions serving households’ (NPISHs) total income coming from wages and salaries less taxes were NOK16.5 billion higher than in the first quarter of 2007. Pensions and social contributions from the government sector were about 6.5 per cent higher than in the corresponding quarter of 2007. This was mainly due to the increase in pensions and sickness benefits. Sickness benefits have increased by 11.3 per cent during the first half of this year.
The real household disposable income grew by 5.6 per cent in the latest quarter compared to the 2nd quarter of 2007.
Property expenditure for the households has recently showed a sharp increase. The expenditures were about NOK 11 billion higher in the second quarter of 2008, compared with the same period of 2007.
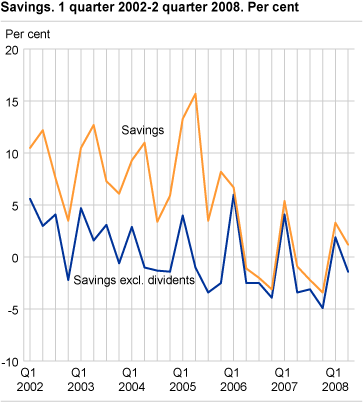
Savings, defined as disposable income minus final consumption expenditure and corrected, amounted to NOK 3 billion in the second quarter of 2008. The household saving ratio was 1.2 per cent in the second quarter of 2008.
| 2006 | 2007 | 2nd quarter 2006 | 3rd quarter 2006 | 4th quarter 2006 | 1st quarter 2007 | 2nd quarter 2007 | 3rd quarter 2007 | 4th quarter 2007 | 1st quarter 2008 | 2nd quarter 2008 | |||||||||||||||||||||||||||||
|---|---|---|---|---|---|---|---|---|---|---|---|---|---|---|---|---|---|---|---|---|---|---|---|---|---|---|---|---|---|---|---|---|---|---|---|---|---|---|---|
| Disposable income | 862 116 | 923 459 | 209 938 | 218 379 | 222 412 | 226 451 | 225 780 | 232 810 | 238 418 | 234 208 | 245 768 | ||||||||||||||||||||||||||||
| Disposable income excluding dividends | 854 478 | 909 423 | 206 882 | 217 233 | 220 501 | 223 644 | 220 166 | 230 704 | 234 909 | 230 973 | 239 298 | ||||||||||||||||||||||||||||
RevisionsQuarterly institutional sector accounts are based on preliminary calculations. The uncertainty is greater in the last quarter of the year. New information is continuously integrated in the figures, which means that the previously released data might be revised. Quarterly institutional sector accounts are consolidated against the data from the quarterly national accounts data as well. |
Tables
Additional information
Contact
-
Pål Sletten
E-mail: pal.sletten@ssb.no
tel.: (+47) 99 29 06 84
-
Nils Amdal
E-mail: nils.amdal@ssb.no
tel.: (+47) 91 14 91 46


