Content
Published:
This is an archived release.
Weak growth in household income
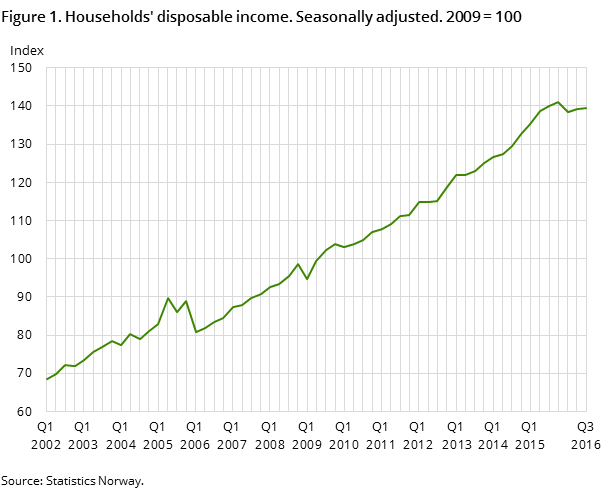
Seasonally-adjusted figures for the 3rd quarter of 2016 show that household disposable income was broadly in line with the previous quarter, while savings fell.
| 4th quarter 2015 | 1st quarter 2016 | 2nd quarter 2016 | 3rd quarter 2016 | |
|---|---|---|---|---|
| Compensation of employees | 368 104 | 367 975 | 369 016 | 371 361 |
| Disposable income | 342 786 | 336 141 | 338 399 | 338 774 |
| Consumption | 324 376 | 330 438 | 333 396 | 334 027 |
| Saving | 36 483 | 23 950 | 22 008 | 21 127 |
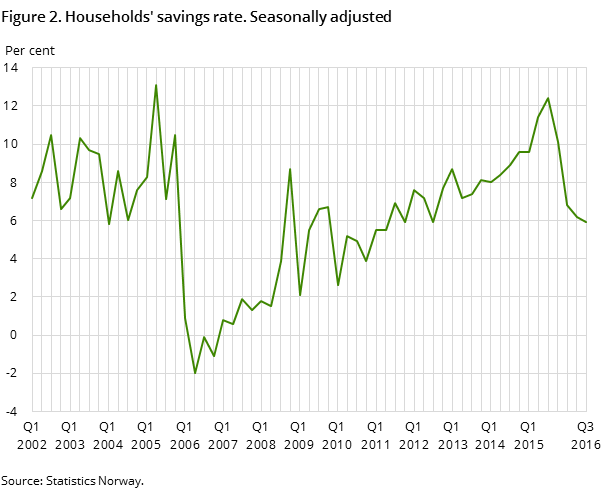
| Savings ratio (per cent) | 10.1 | 6.8 | 6.2 | 5.9 |
| Real disposable income, growth | -0.6 | -4.9 | 1.7 | 0.3 |


Seasonally-adjusted compensation of employees, which is the largest income component for households, rose by NOK 2.3 billion from the 2nd to the 3rd quarter of 2016. This represents an increase of 0.6 per cent. Total revenues grew in line with total expenditures, so there was roughly no change in household disposable income.
Increased consumer spending and reduced adjustment for households’ savings in pension funds contributed to the savings of NOK 21 billion in the 3rd quarter. This is a slight drop in savings from the 2nd quarter. The seasonally-adjusted savings rate ended at 5.9 per cent in the 3rd quarter, compared to 6.2 per cent in the previous quarter.
Lower net lending of general government
Preliminary seasonally-adjusted figures show that general government revenue was slightly lower than the expenses, giving a slight fall in disposable income in the 3rd quarter. In addition, both final consumption expenditures and fixed capital formation increased, which led to a decrease in net lending in the 3rd quarter. This development in general government net lending has persisted for a while, and the decline in the first three quarters was 40 per cent, compared with the same period in 2015.
Seasonally-adjusted disposable income in the enterprises sector was NOK 69 billion in the 3rd quarter, an increase of NOK 2 billion from the previous quarter. Fixed capital formation decreased and thereby meant an increase in net lending by NOK 11 billion to NOK 19 billion.
Lower disposable income for Norway
Seasonally-adjusted figures for the national accounts show that Norway's disposable income rose slightly in the 3rd quarter. There is still a drop in disposable income when factoring in the development in the first three quarters compared with the same period last year. The reason for this is both the decline in gross domestic product as a result of lower oil prices, and reduced net income in the form of wages, capital income and transfers from abroad. For more information on gross domestic product, see the quarterly national accounts.
In this publication, Statistics Norway has released for the first time seasonally-adjusted non-financial sector accounts for all institutional sectors, i.e. non-financial enterprises, financial enterprises, general government, households, non-profit organisations serving households (NPISHs), and the rest of the world. For variables also included in quarterly national accounts, the figures are the same as those presented there. Time series cover all quarters dating back to the year 2002.
RevisionsOpen and readClose
Quarterly sector accounts are based on preliminary calculations. The uncertainty in the last quarter is the largest. New information is continuously being integrated into the figures, which could cause revisions in the previously released data. Quarterly sector accounts are also consolidated against the data from the quarterly national accounts data. When the last quarters of the unadjusted series are updated, seasonally-adjusted series may also be revised backwards.
Additional information
Contact
-
Pål Sletten
E-mail: pal.sletten@ssb.no
tel.: (+47) 99 29 06 84
-
Nils Amdal
E-mail: nils.amdal@ssb.no
tel.: (+47) 91 14 91 46
