Content
Published:
This is an archived release.
Minor changes in GDP Mainland Norway
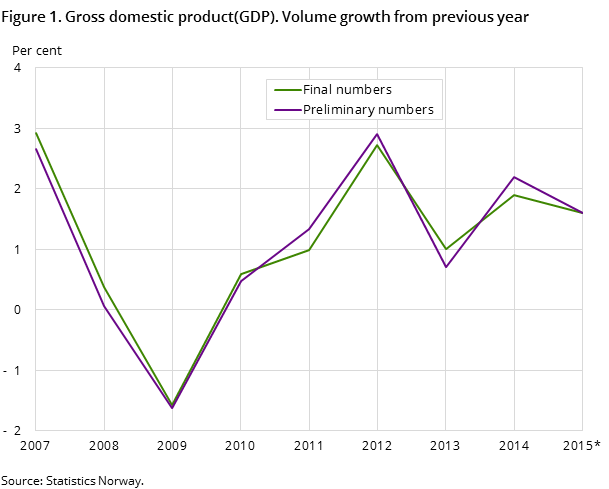
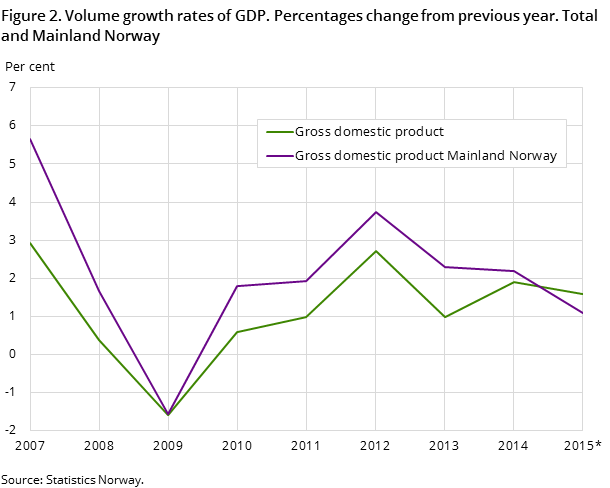
Final figures for 2014 show growth in GDP for Mainland Norway at 2.2 per cent. This is a downward revision of 0.1 percentage point from previous estimates. The GDP for Mainland Norway for 2015 is calculated to 1.1 per cent, which is 0.1 percentage point higher than previously calculated.
| 2014 | 2015 | |||||
|---|---|---|---|---|---|---|
| Earlier | Revised | Revisjon in per cent point | Earlier | Revised | Revisjon in per cent point | |
| Growth in gross domestic product (GDP) | 2.2 | 1.9 | -0.3 | 1.6 | 1.6 | 0.0 |
| Gross domestic produkt Mainland Norway | 2.3 | 2.2 | -0.1 | 1.0 | 1.1 | 0.1 |
| Petroleum activities and ocean transport | 2.0 | 1.0 | -1.0 | 3.8 | 3.7 | -0.1 |
| Mainland Norway (basic values) | 2.0 | 2.2 | 0.2 | 0.9 | 1.1 | 0.2 |
| Manufacturing and mining | 3.5 | 2.8 | -0.7 | -3.3 | -3.2 | 0.1 |
| Production of other goods | 4.8 | 3.9 | -0.9 | 2.8 | 2.8 | 0.0 |
| Service industries | 1.8 | 1.8 | 0.0 | 1.0 | 1.1 | 0.1 |
| General government | 2.0 | 1.9 | -0.1 | 1.6 | 1.8 | 0.2 |
| Final domestic use of goods and services | ||||||
| Household final consumption exp | 1.7 | 1.7 | 0.0 | 2.0 | 2.1 | 0.1 |
| Final consumption exp. of general government | 2.9 | 2.7 | -0.2 | 1.9 | 2.1 | 0.2 |
| Gross fixed capital formation. | 0.0 | -0.7 | -0.7 | -4.2 | -3.8 | 0.4 |
| Mainland Norway | 1.3 | 0.4 | -0.9 | 0.0 | 0.6 | 0.6 |
| Total exports | 2.2 | 3.1 | 0.9 | 3.4 | 3.7 | -0.3 |
| Total imports | 1.5 | 2.4 | 0.9 | 1.1 | 1.6 | 0.5 |
| Growth in employed persons and productivity | ||||||
| Employed persons | 1.1 | 1.2 | 0.1 | 0.5 | 0.3 | -0.2 |
| Houers worked | 1.5 | 1.4 | -0.1 | 0.6 | 0.3 | -0.3 |
| Full-time equivalent | 3.1 | 3.1 | 0.0 | 2.8 | 2.8 | 0.0 |
| GDP per houers worked | 0.8 | 0.5 | -0.3 | 1.0 | 1.3 | 0.3 |
| Growth in prices | ||||||
| Price deflator for GDP | 0.5 | 0.3 | -0.2 | -2.3 | -2.3 | 0.0 |
| Price deflator for GDP Mainland Norway | 2.1 | 2.5 | 0.4 | 2.5 | 2.3 | -0.2 |
| Price deflator for Houshold final consumption exp. | 2.0 | 2.2 | 0.2 | 2.2 | 2.2 | 0.1 |


Total GDP for 2014 is revised down by 0.3 percentage points to a growth of 1.9 per cent. The change is due to weaker growth in oil and gas extraction. The preliminary data showed a growth of 1.8 per cent, but the final figures shows growth of 1.0 per cent. A weaker growth in ocean transport abroad also contributed to the downward revision.
The downward revision of GDP for Mainland Norway is mainly due to less growth in production of other goods. Production of other goods includes construction, which in the final figures showed much weaker growth than previous figures based on production indices for construction. Manufacturing industries are also revised down from 3.5 to 3.0 per cent. Despite many industries in manufacturing showing a better development than in the previous figures, this has not offset the much weaker development of refined petroleum, chemical and pharmaceutical products together with the industry repair and installation of machinery and equipment.
Service activities had a growth of 1.8 per cent, which is unchanged from previous figures. See the revisions in a separate table.
Household consumption is unchanged
Household consumption had a volume growth of 1.7 per cent in the final figures for 2014, which is the same as shown in preliminarily figures. Despite the unchanged total growth, households’ consumption of goods and services has shown some changes. Consumption of goods has been revised up and services have been revised down slightly. This is the lowest growth in household consumption in 25 years, except for the years 2008 and 2009. Gross fixed capital formation for 2014 is calculated to a growth of minus 0.7 per cent in the final figures. Revised preliminary figures for 2015 show a growth of minus 3.8 per cent.
Concepts and classifications in national accountsOpen and readClose
For more information about definitions of the main concepts, variables and classifications in national accounts, see About the statistics, definitions.
How the figures are calculatedOpen and readClose
Preliminary annual data is calculated by summarising four quarters from Quarterly National Accounts (QNA). The figures are preliminary until final annual data are presented 1.5 year after calculated year. Final annual data are then incorporated as base year for the QNA.
In both the ANA and QNA, the figures stripped of movements in prices are referred to as volume changes, or fixed price estimates, and this is done to identify the underlying cyclical pattern of the economy.
The statistics is now published as National accounts.
Additional information
Special tables for experienced users:
Contact
-
Statistics Norway's Information Centre
E-mail: informasjon@ssb.no
tel.: (+47) 21 09 46 42
